
Neoview Workload Management Services Guide (R2.5)
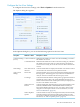

In the Monitoring Query window, the query details are organized into these group boxes:
DescriptionGroup Box
Displays time-based metrics for the query. The set of metrics varies depending on the
version of the Neoview platform to which you are connected. See “Time-Based Metrics”
(page 130).
Time-Based Metrics
Displays metrics related to the rate of consumption of resources since the previous time
interval, which is the difference between the last two sample intervals, the current minus
the previous sample. See “Rate-Based Metrics” (page 131).
Rate-Based Metrics
Displays miscellaneous information about the query, including user information, process
information, warning levels, query type, state of the query, and so on. See “Miscellaneous
Facts” (page 131).
Miscellaneous Facts
Displays information about rule warnings that occurred while the query was running.
Some WMS rules trigger a warning level when they evaluate to true. See “Rule Warnings”
(page 133).
Rule Warnings
Displays the SQL text associated with the monitored query. See “Query Text” (page 133).Query Text
Displays estimates of the resources required by the query and used by Neoview SQL to
generate query execution plans. This information is static for the life of the query, meaning
that it does not change while the query executes. The set of metrics varies depending on
the version of the Neoview platform to which you are connected. See “Compile-Time
Metrics” (page 135).
Compile-Time Metrics
Displays the actual resources used by the query or metrics related to the current state of
the query. This information changes over time (when the information is sampled or
aggregated) while the query is running. The set of metrics varies depending on the version
of the Neoview platform to which you are connected. See “Run-Time Metrics” (page 136).
Run-Time Metrics
Displays the runtime statistics on a per-table basis. These are the individual statistics for
each table involved in the query. See “Per-Table Statistics” (page 137).
Per-Table Statistics
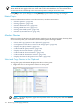
To expand the viewing area of one of the group boxes, click the icon.
To minimize the viewing area, click the icon.
NOTE: You can also get a snapshot of the query details by using a WMS command. For more
information, see the “STATUS QUERIES Command” (page 229) (or “STATUS QUERY Command”
(page 238)).
Monitor Queries 129