
Neoview Workload Management Services Guide (R2.5)
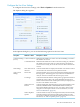

6 Monitoring and Managing Workloads
• “Live View in the NPA Tools” (page 121)
• “Monitor Queries” (page 126)
• “Manage Queries” (page 142)
• “Monitor WMS Services” (page 146)
• “Manage WMS Services” (page 151)
• “Monitor System Resources” (page 165)
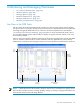
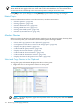
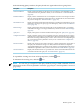
Live View in the NPA Tools
The Live View in the Neoview Performance Analyzer or the Neoview Query Viewer displays
the queries that are currently running in the system (or have completed in the last minute) and
are being managed by WMS. When you connect to the Neoview platform (as described in
“Connecting to the Neoview Platform” (page 37)), the Live View automatically loads a list of
the currently running queries and refreshes its display at regular intervals, which occur every
30 seconds by default.
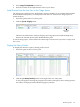
The Live View also displays dynamic summaries of the queries running in the system, the WMS
services, and the system resources. Those summaries are also updated every 30 seconds by
default. This screen shows the main parts of the Live View in the Neoview Performance Analyzer:
Queries
Running
in WMS
Queries
Summary
Services
Summary
System Resources
Summary
Live
View
Pane
NOTE: Unlike the Neoview Performance Analyzer, the Live View in the Neoview Query Viewer
does not have toolbar icons for creating, opening, saving, or locking a workspace and does not
have the Get Session and Load Triage buttons.
Live View in the NPA Tools 121