HP Neoview Performance Analysis Tools User Guide HP Part Number: 613731-001 Published: July 2010 Edition: HP Neoview Release 2.
© Copyright 2010 Hewlett-Packard Development Company, L.P. Confidential computer software. Valid license from HP required for possession, use or copying. Consistent with FAR 12.211 and 12.212, Commercial Computer Software, Computer Software Documentation, and Technical Data for Commercial Items are licensed to the U.S. Government under vendor’s standard commercial license. The information contained herein is subject to change without notice.
Table of Contents Learn About This Document...............................................................................................7 Publishing History..................................................................................................................................7 New and Changed Information in This Edition.....................................................................................7 Intended Audience...........................................................................
Disconnect/Reconnect to the Neoview Platform..................................................................................25 3 Use the Workspace Toolbox.......................................................................................27 The Workspace Toolbox At a Glance....................................................................................................27 Add Tools........................................................................................................................
Run-Time Metrics.......................................................................................................................49 Miscellanous Facts......................................................................................................................50 Rule Warnings............................................................................................................................52 Per-Table Statistics...........................................................................
Triage Space Query Details...................................................................................................................82 Triage Space Statement Counters.........................................................................................................87 Load Queries from the Triage Space to Query Workbench..................................................................87 8 Use the Query Workbench.................................................................................
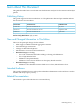
Learn About This Document This guide describes how to use the Neoview Performance Analysis Tools to monitor and analyze queries. Publishing History This guide supports HP Neoview Release 2.5. The publication date and part number indicate this document’s current edition: Part Number Product Version Publication Date 613731–001 HP Neoview Release 2.5 July 2010 586321-001 HP Neoview Release 2.4 SP1 September 2009 544814-001 HP Neoview Release 2.
Neoview Customer Library The manuals in the Neoview customer library are listed here for your convenience. • Administration Neoview User Management and Security Administration Guide Information about security features on the Neoview platform, including user and role management for database and platform users, support for integration with Lightweight Directory Access Protocol (LDAP) directory servers, password encryption, and database security.
• Connectivity Neoview JDBC Type 4 Driver API Reference information about the HP Neoview JDBC Type 4 Driver API. Reference Neoview JDBC Type 4 Driver Programmer’s Reference Information about using the HP Neoview JDBC Type 4 driver, which provides Java applications on client workstations access to a Neoview database. Neoview ODBC Drivers Manual Information about using HP Neoview ODBC drivers on a client workstation to access a Neoview database. • Neoview ADO.
1 Install and Start the HP Neoview Performance Analysis Tools What are the HP Neoview Performance Analysis Tools? The Neoview Performance Analysis Tools provide insight into queries running on the Neoview data warehousing platform. Prior to Neoview Release 2.3 SP3, this product was known as Neoview Performance Analyzer. In Neoview Release 2.3 SP3 and following releases, Neoview Performance Analyzer is one of three components of the Neoview Performance Analysis Tools (NPA Tools).
• Neoview Query Viewer — Live operational view of queries running on the Neoview platform. Standalone product. Same as Live View in Neoview Performance Analyzer. • Neoview Query Workbench — Query plan analysis and execution tool. Standalone product. Same as Query Workbench in Neoview Performance Analyzer.
Similarly, the Query Workbench pane in NPA is mostly the same as the standalone tool Neoview Query Workbench. Functionality for both tools is described in this document as Query Workbench. Install the Neoview Performance Analysis Tools The HP Neoview Performance Analysis Tools are installed by using a Windows installer. You can find the installer by searching for “HP Neoview Performance Analysis Tools” on the HP Software Depot web site http://www.software.hp.com/. Additionally, the R2.
NOTE: You must connect to the Neoview data warehousing platform through the client driver to use the full capabilities and features of the Neoview Query Viewer. See “Connect to the Neoview Platform” (page 22). Start the Neoview Query Workbench To start the Neoview Query Workbench, double-click the Neoview Query Workbench icon on your desktop or select Start>All Programs>HP Neoview Performance Analysis Tools>Neoview Query Workbench.
2 Use the Workspace Neoview Performance Analyzer Workspace The workspace is the heart of the Neoview Performance Analyzer and all activity occurs within this space. The workspace is a content area where you can design the layout of the performance tools and views. You can customize a view of the Neoview platform that you want to see. A new workspace can be created through the Workspace menu bar command. See “Start a Workspace” (page 16).
The Neoview Pane The Neoview pane allows you to define which system metrics and workload metrics you want to display in the workspace content area. Through the use of views, you can switch between different layout types and make performance decisions on the resource usage of the system and the areas and workload that need to be investigated and optimized. “Use the Neoview Pane” (page 31) describes the features available for use.
Define the Layout for the Workspace To define the layout of your workspace, drag the tools you want to use from the Workspace Toolbox. The Timeline Controller appears as soon as you add any tool. For more information about the tools and workspace toolbox, see “The Workspace Toolbox At a Glance” (page 27). Save a Workspace Layout To save a workspace layout, select Save from the Workspace menu bar or click the disk icon on the toolbar. You can also select Save As from the Workspace menu bar.
The shortcut menu provides options for properties of the view. To access the shortcut menu and change these properties for the workspace, right click within the data grid. Workspace Title The workspace title displays the current connection information and appears at the top of the application in this format: WorkspaceName (SystemConnection: DataSource) User: Username (Usertype) • • • • • WorkspaceName is the name assigned to the workspace. The first workspace is called Default Workspace.
Windows, and Help. For Neoview Query Viewer and Neoview Query Workbench, the menu bar commands are Workspace, Edit, Tools, Display, and Help. Menu Bar Command For More Information, See ...
Use the Tools Menu Options The Tools menu options are: Menu Option Description Options Sets global or workspace specific options. Tracing Reserved for internal use. Configure Client Thresholds Launches the Client Threshold configuration user interface. Configure Workload Management Services Launches the Workload Management Services configuration user interface.
Task Toolbar The task toolbar provides quick access to standard features as well as NPA-specific tasks: Workspace Toolbox The workspace toolbox appears at the bottom of the application. Rename a Workspace By default, workspaces are numerically named (Default Workspace, New Workspace #2, and so on). To rename the workspace to a different name, select Rename from the Workspace menu bar. You can also rename the workspace by selecting Save or Save As from the Workspace menu bar.
Option Description Time Settings Described in “Adjust Time Settings” (page 32), allow you to change time-related values for NPA. Query Workbench Settings Described in “Query Workbench Settings” (page 92), allow you to control the Query Workbench behavior. Repository Views Settings Described in “Switching Repositories” (page 78), allow you to switch repositories on the fly. Add Another Workspace To add another workspace, select Workspace>New from the menu bar.
This table shows reference information for the Connect dialog box: Field Example Description Data Source MY_DSN Specifies the name of the data source. If no data source is specified, or if the specified client-side data source cannot be found on the server, the client connects to the default data source (TDM_Default_DataSource). User ID user-jan Your user name. This is a required field. Password User: 2$o!RIs0 User/Role: 2$o!RIs0/4!1WawAy Your Neoview password. This is a required field.
Field Example Description Role Name ROLE.DBA Neoview role. Note these considerations: • If you are a platform user, leave this field blank. • If you are a database user and you leave this field blank, NPA Tools uses your default role. • For database users, if you specify a role and then need to log on using a different role, you must disconnect and specify the new role when you reconnect to the system. Host Name XYZ0101.xyz.abc.com The DNS name or IP address for the target Neoview platform.
Disconnect/Reconnect to the Neoview Platform To go offline from the Neoview platform, select the Disconnect icon (red “X”). To reconnect to the Neoview platform, select the Reconnect icon (wavy arrows).You might need to reconnect in cases of error or connection timeouts or failures. If you disconnect a workspace from the Neoview platform, all tools will stop updating and any queries that you executed or explain plans generated in the Query Workbench pane will complete immediately with errors.
3 Use the Workspace Toolbox The Workspace Toolbox At a Glance The workspace toolbox is a panel of tools that you can use to graphically map the state of the Neoview platform. These tools map various performance metrics either at the system or workload level. The workspace toolbox appears at the bottom of all NPA views, including Neoview and customized views, Live View, Triage Space, and the Query Workbench. However, you use the metrics only in the Neoview and customized views.
System Metrics Tool The System Metrics tool is a shortcut to select the default system metric tools in a single view. When selected, these tools are added to the workspace: Processing Node Utilization, Processing Node Queue Length, Cache Hits, and System I/O Activity. The default aggregate function for Processing Node Utilization and Processing Node Queue Length is an average function. The other metrics use a total (or sum) aggregate function by default.
2. 3. 4. 5. the Workload Metric. For more information about filter definition, see “Filter the Queries” (page 80). To save the filter, select Save at the top of the Workload Filters. The filter is saved in XML file format (*.xml). In the Neoview pane, add a Workload Metric tool from the workspace toolbox. Enter the name of the previously saved filter. In Workload Graph Configuration, select the information you want to graph.
4 Use the Neoview Pane Neoview and Customized Views The Neoview and customized views allow you to define which system and workload metrics you want to display in the workspace content area. Through the use of views, you can switch between different layout types and make performance decisions on the resource usage of the system and the areas and workload that need to be investigated and optimized. NOTE: To view graph information, you must select Fetch Timeline Information in Tools>Options.
Select Content to Analyze In the Neoview or customized views, you have full control over the performance metrics to be displayed. You can use the workspace toolbox to drag as many tools as you want onto the content area and rearrange and resize the graphs. The type of tool and the performance metric that is graphed varies depending to the type of tool that you drag onto the workspace content area (that is, in the Neoview pane or customized view).
NOTE: You cannot delete the Neoview pane. Other Tasks on Graphs Place the cursor in a graph and right click to show the shortcut menu. The shortcut menu provides these tasks: Task Description Copy Copies a graph to the clipboard. Save Image As Saves the current graph based on a selected format to a file. Available formats include png, jpg, gif, tif, and bmp. Page Setup Sets up the graph's page layout for printing, allows you to select the paper size and source, page orientation, and margins.
5 Use the Live View Pane The Live View pane provides a point-in-time display. It displays queries that are currently running on the system (or completed in the last 1 minute) with information from the Neoview Workload Management Services (WMS). In the Neoview Performance Analyzer, Live View is one of the four panes. The Live View pane in the Neoview Performance Analyzer provides the same information as the Neoview Query Viewer, which is a standalone tool for operational support.
are connected to the Neoview platform, Live View automatically downloads a list of currently running queries and refreshes itself on a pre-configured interval basis (the default is every 30 seconds for Release 2.3 platforms and higher, and five minutes for Release 2.2 platforms). NOTE: Neoview Query Viewer does not show the Get Session or Load Triage buttons. Configure Live View To configure the Live View options, select Tools>Options to adjust the settings.
Abnormally Terminated. Queries with the Abnormally Terminated state will age out and be removed from the display. Actions on Live View Queries The Live View displays its own SQL statements in the query list. Queries, SPJ calls, and other SQL statements initiated by Live View are identified by the text “Neoview Performance Analyzer” or “Neoview Query Viewer” in the APPLICATION_ID field. Query management actions against such queries are discouraged.
Threshold Rule Creation Wizard To open the Threshold Rule Creation Wizard, which provides various menu items to help with the creation or modification of thresholds, select New Rule or Edit Rule in the Client Threshold Rule Manager. In order for a threshold to be completed, it must be applied to one or more workspaces and it must have a name. Notice the tabbed areas directly below the screen title: Workspaces, Conditions, and Actions.
Workspaces Tab The Workspaces tab is the first tab displayed when the Threshold Rule Creation Wizard is opened. The Workspaces tab lists the workspaces that are open in NPA and allows you to enable this threshold for specific workspaces by checking the box to the left of the workspace name. All Workspaces this session means all currently open workspaces (for NPA only as this tool only allows multiple workspaces) and any future workspaces that may be opened for this client instance.
Running Threshold Rules After a threshold rule has been created and has been enabled for one or more workspaces, the rule will perform the indicated action when a violating query is loaded into the Triage Space from a fetch or Live View operation.
6 Neoview Workload Management Services (WMS) Configuration Configuring Neoview WMS Services and Rules With Live View Neoview Performance Analysis Tools include a point-and-click interface for configuring Workload Management Services (WMS) services and rules through the Live View pane. You can use the NPA tools to: Use the NPA Tools to... See ...
When you click on [Monitor Query], Live View brings up the Query Details window for the query that allows you to watch query executions. You can watch multiple running queries simultaneously. The same “watch” or monitoring functionality can also be achieved by double-clicking on a query in the Live View (grid containing the list of running queries). This information is only available for queries that are currently running or that completed recently (that is, queries for which Neoview WMS has information).
Category Description “Per-Table Statistics” (page 52) Statistics on a per-table basis. These are the individual statistics for each table (per-table) involved in the query. See “Per-Table Statistics” (page 52). “Get Query Text ” (page 52) Provides the ability to retrieve the query text associated with the monitored query. See “Get Query Text ” (page 52). You can click on any of the columns in the metrics to order the layout as you prefer.
The Session Statistics window appears: This list provides a short description of the Session Statistics fields: 44 Statistic Description Application Id Client application name or main window caption. Client Id Client host name. Client User Name The name of the user who originated the session by logging in to a workstation. If the name is not available from the ODBC driver, this field is NULL. Component Name Name of the NDCS component to which the statistics apply, e.g., ODBC_Server.
Statistic Description Datasource Client data source name used at the time of the connection. Ldap Login Elapsed Time Mcsec Time in microseconds spent on communication with the external authentication server, including time waiting for replies from the server. For platform users, such as super-user or SecurityAdmin, the value is 0. Metric Class Id Repository-assigned value. Used internally. Metric Class Version Repository-assigned value. Used internally.
Statistic Description Total Errors Total number of SQL statement execution errors detected by the NDCS SQL server. Total Execdirects Total number of SQLExecDirect calls. Total Executes Total number of SQLExecute calls. Total Fetches Total number of SQLFetch calls. Total Insert Stmts Executed Total number of SQL INSERT statements sent by the client driver (ODBC, JDBC, or ADO.NET) to the NDCS SQL server. Does not include internally generated SQL statements.
Metric Description Elapsed Time The amount of time for which a query ran (or is running). This is the time since the start of the query until the current time for running queries or a difference of the start and end times for completed queries. Display format is hh:mm:ss (hour, minute, and seconds). Wait Time Indicates how long a query waited before it started execution (time from entry into the system until the time the query actually started its execution).
Metric Description Delta IUD Indicates the difference (current – previous interval samples) in the number of rows inserted, updated, or deleted. IUD/Second Provides the rate of the number of rows inserted, updated, or deleted per second. Compile-Time Metrics Compile-time metrics are used by Neoview SQL to generate query plans and provides a view of the estimates of resources required by a query. This information is static for the life of a query (meaning it does not change while a query executes).
Metric Description Compilation Disk Process Rows Accessed Indicates an estimate of the number of rows accessed in the disk process. Compilation Disk Process Rows Used Indicates an estimate of the number of rows used in the disk process. Run-Time Metrics Run-time metrics indicate the actual resources that have been currently used by the query or metrics that relate to the current state of the query. This information varies and will change over time when this information is sampled or aggregated.
Metric Description Processes Created Number of Executor server processes created. Disk Process BusyTime Processor (CPU) utilization by the disk process. SQL CPU Time Processor (CPU) utilization by Neoview SQL. Process Create Time Amount of time to create Executor Server Processes (ESPs). Open Time Amount of time spent on opens. SQL Space Alloc Total space allocated by Neoview SQL. Space is the memory allocated at compile time. SQL Space Used Total space used by Neoview SQL.
Metric Description Parent Query ID ID of the parent query. If there is no parent query ID associated with the query, NONE is displayed. Query Priority Process priority of the master executor process. Transaction ID ID of the transaction under which the query is executed. When there is no transaction, the transaction ID is -1. Rows Returned Number of rows returned from the root operator of the master executor process.
Rule Warnings Rule warnings display any warnings of Neoview WMS rule violations. The query’s WARN_LEVEL (Warning Level) state is an indicator of rule warnings that were generated. The warning levels currently supported and generated are Low, Medium, and High. This information is only available for platforms enabled with Neoview WMS support for rules (that is, R2.4 and higher). Per-Table Statistics Per-table statistics display the runtime view of individual statistics for all tables involved in the query.
To bring up a detailed window that provides current service configuration on the Neoview platform, click on the magnifying glass icon from either the Statement Counters summary or the Services summary panes (described in “Statement Counter Summary Information” (page 53) and “Service Counters Summary Information” (page 53)).
configured and active services and the number of services that have exceeded their threshold settings. On the upper right corner of the summary box is a magnifying glass icon, which allows you to drill down and display details about historical information of Neoview WMS services. Clicking on this icon will bring up a detailed screen. See “Statement and Service Counter Details” (page 55).
Statement and Service Counter Details To bring up a detailed window that provides current service configuration on the Neoview platform and historical details of statement counters retrieved by this Live View instance, click on the magnifying glass icon from either the Statement Counters summary (see “Statement Counter Summary Information” (page 53)) or the Services summary (see “Service Counters Summary Information” (page 53)).
"Mon, 24 May 2010 12:25:56 GMT", 5/24/2010 12:25:56 PM, 0.263803899288177, 20.2562503814697, HPS_MANAGEABILITY, ACTIVE, HIGH, 0, 0, 0, FROM 00:00 TO 24:00, NO_PLAN, NO_TEXT, 0, 0, 0, SET SESSION DEFAULT MASTER_PRIORITY '160'; "Mon, 24 May 2010 12:25:56 GMT", 5/24/2010 12:25:56 PM, 0.263803899288177, 20.2562503814697, HPS_TRANSPORTER, ACTIVE, MEDIUM, 0, 0, 0, FROM 00:00 TO 24:00, NO_PLAN, NO_TEXT, 0, 0, 0, SET SESSION DEFAULT MASTER_PRIORITY '110'; "Mon, 24 May 2010 12:25:56 GMT", 5/24/2010 12:25:56 PM, 0.
The left pane displays all available WMS configuration entities in a hierarchical tree structure. The entities include the WMS system configuration, WMS service configuration, rules configuration, and admin role configuration. The right pane displays the configuration details for the configuration entity that is currently selected in the tree.
Field Description Rule Start Interval (1-30 minutes) Interval, in minutes, after a query starts executing when WMS starts evaluating the execution rules. Hidden for releases prior to R2.5. Execution Timeout (minutes) (0-1440) Maximum time interval a query can be in the executing state before the query automatically times out. Default from WMS system configuration. Hidden for R2.3 systems.
This table describes the attributes of the WMS services that appear in the Services Summary pane.
Field Description SERVICE_PRIORITY Priority of the service relative to other services in WMS: • URGENT • HIGH • MEDIUM-HIGH • MEDIUM • LOW-MEDIUM • LOW NOTE: The service priority is not a process priority. MAX_CPU_BUSY Maximum CPU busy allowed. Zero means this threshold is not checked. MAX_MEM_USAGE Maximum memory usage allowed. Zero means this threshold is not checked. MAX_ROWS_FETCHED Maximum number of rows that can be returned.
• • • • be stopped. If one of these system-created services is in the selected list, it will be ignored and informational message will be displayed. [Hold] and hold service toolbar (two parallel bars icon) are enabled if one or more rows are selected in the data grid. If enabled, you can place the selected services on hold. Only services that are in an active state can be placed on hold. Services that are not in an active state are ignored and an informational message is displayed.
This table describes the interface attributes: Attribute Description Service Name (max . 24 characters) Name of the service. Service names support Neoview character sets. Service Priority (URGENT, HIGH, Priority of the service. MEDIUM-HIGH, MEDIUM, LOW-MEDIUM, LOW) Max Processor Utilization (0-100) % Percentage of CPU utilized. Default from WMS system configuration. Max Memory Usage (0-100) % Percentage of memory used. Default from WMS system configuration.
The following attributes are displayed: Attibute Description Service Name (max . 24 characters) Name of the service. This is a read-only field. Service Priority (URGENT, HIGH, MEDIUM-HIGH, MEDIUM, LOW-MEDIUM, LOW) Priority of the service. You cannot alter the priority of the system-created services HP_DEFAULT_SERVICE, HPS_MANAGEABILITY, HPS_TRANSPORTER. Service priority is disabled for system-created services. State Displays the current state of the system. This is a read-only field.
Attibute Description Hold Timeout (minutes) (0-1440) Maximum time interval a query can be in the holding state before the query automatically times out. Default from WMS system configuration. R2.4 feature. Hidden for R2.3 systems. SQL Plan (True/False) Indicates if the WMS server processes should temporarily store the SQL Plan. SQL Text (True/False) Indicates if the WMS server processes should temporarily store the SQL Text. Comments (max.
Selecting Stop Immediately cancels all executing queries in the service, instead of allowing the queries to finish executing. Waiting queries are rejected, and no new queries are allowed into the service. You can also right click on a specific service in the configuration tree and select the Stop menu to stop the service. The Stop menu is enabled only if the service is in an active state and is not one of the system-created services HP_DEFAULT_SERVICE, HPS_MANAGEABILITY, HPS_TRANSPORTER.
Note this information about the Rules Summary: • When you select the Connection Rules tree node, only the connection rules are displayed in the right summary pane. • When you select the Compilation Rules tree node, only the compilation rules are displayed in the right summary pane. • When you select the Execution Rules tree node, only the execution rules are displayed in the right summary pane.
NOTE: System-generated rule names start with an HPS_ prefix. You cannot create a rule with the HPS_ prefix. It is reserved for system rules. • • • [Associate] and the Associate icon (paper clip) are used to launch the Associate Rule dialog that lets you associate rules to services. See “Associate Rules to Services” (page 73). The Export configuration icon (save disk) exports the entire WMS configuration into a script as WMS commands which can then be executed using a command interface.
Compilation Rules, or Execution Rules tree node and right click and select the Add Rule menu item. Add a New Connection Rule To add a connection rule, on the Add Rule dialog, set the Rule Type radio button to Connection. • Warn Level and Rule Action attributes are optional. You can specify them as needed. If you select the SQL_CMD action, you can specify a valid SQL statement that shall be executed when the rule is triggered. If NO-ACTION is specified for Rule Action, no action is taken.
When adding a rule, you can provide information in the following fields: Field Name Description Rule Name Name of the rule. Up to 24 characters (can be multi-bytes). Rule names support Neoview character sets.
Add a New Compilation Rule To add a compilation rule, on the Add Rule dialog, set the Rule Type radio button to Compilation. • Warn Level and Rule Action are optional attributes. You can specify as needed. If you select the EXEC action, you can specify a valid SQL statement that is or shall be executed when the rule is triggered. If NO-ACTION is specified for Rule Action, no action is taken.
When adding a rule, you can provide information in the following fields: Field Name Description Rule Name Name of the rule. Up to 24 characters (can be multi-bytes). Rule names support Neoview character sets.
For detailed information about the fields in the description, see the Neoview Workload Management Services Guide. Add a New Execution Rule To add an execution rule, on the Add Rule dialog, set the Rule Type radio button to Execution. • Warn Level and Rule Action attributes are optional. You can specify as needed. NO-ACTION resets the CANCEL action on a execution rule. • In the expression group box, select a predefined property from the drop down box and then enter a value in the Value field.
When adding a rule, you can provide information in the following fields: Field Name Description Rule Name Name of the rule. Up to 24 characters (can be multi-bytes). Rule names support Neoview character sets. Warn Level WARN-HIGH, WARN-MEDIUM, WARN-LOW (Default), NO-WARN Rule Action Empty, CANCEL, NO-ACTION Expression: Logical AND, OR Expression: Property USED_ROWS, ACCESSED_ROWS, TOTAL_MEM_ALLOC, ELAPSED_TIME, CPU_TIME Expression: Operator =.
• • • • • • • • • Select a rule from the list. Next, select a service from the Services list and click [Associate]. The association should appear in the Associated Rules grid. To see a list of services associated to a specific rule, select the rule from the Rules list box and click [Associated Services]. To view the rule information, select the rule and click [Show Rule Info].
• • • • [Add] at the bottom of the screen and the plus sign icon on the toolbar are always enabled and launch the Add Admin Role dialog box that lets you add a new admin role. [Delete] at the bottom of the screen and the delete icon on the toolbar are enabled if one or more rows are selected in the data grid and allow you to delete the selected admin roles. The system-created admin roles (ROLE.DBA, SUPER.SUPER and SUPER.
This list describes the Export WMS Configuration actions: • For the WMS system, an ALTER WMS command is generated. • For each of the user-added services, an ADD SERVICE command is generated. • For the system-added services (HP_DEFAULT_SERVICE, HPS_MANAGEABILITY, HPS_TRANSPORTER) an ALTER SERVICE command is generated. • For each of the user-added rules, an ADD RULE command is generated.
7 Use the Triage Space Pane The Triage Space isolates queries you select in the Neoview and customized views for analysis in the Query Workbench. Triage Space information comes from the Repository. The Triage Space At a Glance The Triage Space pane contains several parts: Triage Space Pane Part Description Query Candlestick Graph Shows a graphical step graph view of the queries represented in the table grid.
Triage Space Pane Part Description Workload Filter Shows the properties filters. Click on the Workload Filter bar to the left side of the table grid to show the filters. See “Filter the Queries” (page 80). Triage Space data grid A table area that shows the queries you selected in the Neoview Pane. You can resize the table grid. Additionally, the fetch limit setting for the Triage Space is 20000. You can change the fetch limit (Triage Space Settings Fetch Limit) by choosing the Tools>Options selection.
Query Candlestick Graph The query candlestick graph is a graphical representation of the way workloads and queries ran over a specific period of time. The list of queries in the query candlestick graph is the same that the queries in the Triage Space data grid. The candlestick graph is a visual representation of those workloads or queries. On the graph, the X-axis (horizontal) is the list of queries than ran or were running on the Neoview platform. The Y-axis (vertical) represents the start to end time.
Triage Space Button Panel The Triage Space button panel commands: Buttons Description [Preview SQL] Shows a preview (three lines) of the SQL statement for each query. [Show Hidden] Shows previously hidden queries. [Hide] Hides queries that you highlight in the Triage Space data grid. You can hide multiple queries in the Triage Space data grid. If you hide queries in the Triage Space data grid, they are also hidden in the candlestick graph.
Dimensions: Filter Description Applications Select application IDs from the list. Click on the icon at the right side of the blank field for a list of IDs. Clients Select client IDs from the list. Click on the icon at the right side of the blank field for a list of IDs. DataSources Select data sources from the list. Click on the icon at the right side of the blank field for a list of data sources. TimePeriod Custom date and time field.
Triage Space Data Grid The Triage Space data grid is a tabular representation of the queries shown in the candlestick graph. The list of queries control how the candlestick graph is displayed. You can perform preliminary “what-if” analysis by using [Hide] and [Show] on the Triage Space button panel. The rows in the Triage Space data grid are color coded according to their state. Queries with errors are displayed in red, running queries are displayed in green, and completed queries are displayed in blue.
The Query Details tab provides this information: • Type: Metrics Field Description Start Priority Query's starting priority. The priority of the NDCS connectivity server process when this query started execution. Cmp Affinity Num Compiler Affinity Number (indicates processors used). Compilation Degree of Parallelism Degree of parallelism. Cmp Txn Needed Indicates whether a transaction is needed to run this query. Compilation Mandatory Cross Product Indicates whether there is a cross product.
Field Description Rows Usage Estimate Indicates estimated total number of rows that will be used. This is the compiler estimate of the number of rows that the Executor returns in the disk process (EID) after applying the predicates. Total Memory Estimate Indicates estimated total amount of memory. Resource Usage Estimate Indicates estimated total resource usage. Stats Error Code Internal error code returned to the stats collector from the run-time statistics (RMS) infrastructure.
• Field Description Processes Created Number of Executor server processes created. Segment Id Segment Id for the query. Entry Id Entry Id for the query. Sequence Num Sequence num for the query. Type: Miscellaneous Field Description Session Id Session identifier. Set by the client ODBC/JDBC/ADO application. Query Id Query identifier. User Name Name of the user. Role Name Role name associated with the query (role of the user running the query).
• 86 Type: Time Field Description Start Time Indicates the time when the query was submitted into the Neoview system. End Time Indicates the time when the query completed execution. Disk Process Busy Time Sec Cumulative node busy time in seconds for all disk processes involved in executing the query. Master Execution Time Sec Node processing time, in seconds, from the time the execution starts to the time the results are returned.
Triage Space Statement Counters Statement counters appear at the bottom of the Triage Space pane and provide summary information about the queries that are shown in the Triage Space. These counters are indicator values of queries that are running, completed, or that contained errors. Load Queries from the Triage Space to Query Workbench After you have selected the queries you want to analyze and they are highlighted, click [Load Workbench] to load the queries into the Query Workbench.
8 Use the Query Workbench Query Workbench Pane in NPA = Neoview Query Workbench Use the Query Workbench pane to analyze queries. Query Workbench is mostly the same as the standalone tool Neoview Query Workbench, except as noted in this document. The Query Workbench At a Glance The Query Workbench pane contains several boxes: • Query List shows a listing of queries you selected and loaded to the Query Workbench from the Triage Space. For more information, see “Query List Box” (page 92).
• SQL Text shows the SQL statement for the query selected in the Query List. For more information, see “SQL Text Box” (page 93). • Statistics shows the statistics and details associated with the query selected in the Query List. For more information, see “Statistics” (page 95).
• Table Statistics shows details about all the tables and statistics about all columns in the tables used in the current Explain query plan. For more information, see “Table Statistics” (page 95). • Query Details shows an organized layout of an Explain plan for the current query in the SQL text box. It contains two tabs: Explain Plan and Execute Output. For more information, see “Query Workbench Query Details” (page 96).
All boxes in the Query Workbench can be moved by selecting the box to move it, or resize by clicking the box in the upper right corner of the box. Query Workbench Settings The Tools>Options>Query Workbench Settings allow you to control the Query Workbench behavior. The available options include: Option Description Max Rows Indicates the maximum number of rows to fetch for an execute operation.
queries are handled differently. See “Difference Between Checked or Selected Queries” (page 93). Notice the icons at the top of the Query List box: Icon Description Open (file folder icon) Loads a previously saved checked query into the Query Workbench. You can only load files in WBD file format (*.wbd). Save (disk icon) Saves checked queries into a file. Files are saved in WBD file format (*.wbd). Set Schema (eye dropper icon) Sets the same schema for checked queries.
• • • • • • “Execute or Explain the Selected Query” (page 94). “Enter a New Query” (page 94) or paste in a query from somewhere else, then execute or explain the selected query. Change the schema name with the “Schema Drop Down” (page 94) box. Change the “Maximum Rows Fetched” (page 94). “Rename the Query” (page 95). Move to another selected query by using the up and down arrow keys. The buttons across the bottom of the SQL Text box allow you to test the query and change it.
Rename the Query You can rename the selected query in the Name text box above the query field. Statistics The Statistics box contains query statistics and details propagated from the query in the Triage Space. The statistics are purely informational and no interactive functionality exists. Statistics are shown only for queries that are loaded from the Triage Space. If a query is changed in the SQL Text box and executed again, the statistics will be invalid.
The columns shown in the Table Statistics include: Column Description UEC Unique entry counts. Column Names Column names in the table. HistID Histogram ID. Ints Histogram intervals. Row Count Count of the rows. Query Workbench Query Details The Query Details box contains the Explain Plan and Execute Output tabs. Explain Plan The Explain Plan area shows the query plan output in a tree view format. The Explain Plan area is divided into three sections.
Operator Groups Each operator is identified in the query tree by an icon that identifies the group type. These are the operator groups: File Scan Root Exchange Insert Split Top Partition Access Tuple ESAM Subset Group By Merge Union Default ESAM Unique Join Sort Data Mining The default icon (question mark) is used for operators not represented by a group.
Analyze the Explain Plan Through the Grid You can sort on the fields in the Explain plan grid (middle section). Note that when you click on an operator in the query plan, the row is highlighted in the grid section. You can sort on the fields in the grid, so if you are interested in the total cost of an operator, you can sort them in ascending or descending cost.
can execute in the master executor or ESP processes, and groupbys can execute in the master executor, ESP, or ESAM processes. Certain scan operators always execute in the same process. For example, the scan operators, including FILE_SCAN and FILE_SCAN_UNIQUE, always execute in the ESAM process. The ROOT operator always executes in the master executor process. NPA plans only show the operators that represent the process boundaries and indicate the number of processes used or accessed.
Execute Output The Execute Output tab shows the executed query. When you select the Execute Output tab, you see the rows retrieved and column count information for the executed query.
9 Tips for Query Plan Performance Improvements NOTE: Refer to the course Neoview Performance Analyzer and Query Plan Workshop, course ID 01105317, for additional information about NPA and query plans. This course is designed to simplify explain plans by utilizing Neoview Performance Analyzer (NPA) to review query plans, identify common problems, and demonstrate physical DB design best practices.
1. 2. 3. 4. 5. 6. Ensure that tables have been reorganized after loads/inserts of large amounts of data. Reorganizing tables keeps data blocks full with rows and physically adjacent, which improves scan performance. Note the cardinality of the FILE_SCAN operator. See Cardinality in the Glossary. a. If the cardinality is very low compared to the table row count, consider whether the use of a secondary index could limit the scan and improve performance. b.
NOTE: The columns used for hash keys appear in the PARTITION_ACCESS operator. The FILE_SCAN operator does not show the hash keys for the table. The presence or absence of hash key predicate values in the query text determines the type of data access strategy, that is, whether one or all partitions are accessed, as follows: • • • Predicates on all hash key columns: the full hash key is available, which is used to limit access to a specific data partition for each row.
10 Keyboard Shortcuts General Shortcuts • • • • • • • • • • • • • • • • • Accept/OK => Enter or or Return Cancel/escape => Esc Close NPA=> Alt + F4 or Ctrl + q Close view/tab => Ctrl + w Connect => F5 Copy => Ctrl + c Cut => Ctrl + x Cycle through workspaces => Ctrl + Tab or Ctrl + F6 Delete => Delete Disconnect => Shift + F5 Focus to next tool => Comma or Ctrl + Comma Focus to previous tool => Period or Ctrl + period Next view/tab => Forward Arrow Paste => Ctrl + v Previous view/tab => Back Arrow Rec
• • • • • • 106 Saves As => Ctrl + s Select All => Ctrl + a Rename => Ctrl + r Load workbench => Ctrl + Alt + l Show/Fetch session => Ctrl + Alt + s Clear => Ctrl + Alt + r Keyboard Shortcuts
Glossary administrator A user who belongs to a role with administrative privileges. By default, these roles are administrators: • super.super • super.services • ROLE.DBA In addition, administrator users can grant administrator privileges to other users. For more information about administrator users, see the Neoview Workload Management Services Guide.
MDAM MultiDimensional Access Method. An optimized scan method that provides improved performance for queries that contain missing predicates on key columns. menu bar A list of commands at the top of the main window. The menu bar commands are Workspace, Edit, Tools, Display, Windows, and Help. merge join A join method where both tables are required to be sorted on the join column.
the users who are granted a role are granted the privileges associated with the role. The Neoview platform can have a maximum of 255 roles. See also database user and platform user. SQL statement Any DML or DDL statement including, but not limited to SELECT, INSERT, UPDATE, DELETE, CREATE, ALTER, DROP, GRANT, and REVOKE. TDM_Default_DataSource TDM_Default_DataSource is the default data source for database access. You cannot delete TDM_Default_DataSource, but you can configure other data sources.
Index A K Admin role add, 75 delete, 75 Aggregate functions, 27 for tools, 27 performance, 101 Aggregated statistics expected execution time interval, 67 frequency, Repository, 67 frequency, WMS, 67 query types, 67 Aggregates, number of queries, 51 Analyze queries, in Query Workbench, 92 workloads, 28 Keyboard shortcuts general shortcuts, 105 menu shortcuts, 105 triage space shortcuts, 105 view shortcuts, 105 workspace shortcuts, 105 Kill selected queries, 36, 82 C Cache Hits tool, 28 Character set supp
exit, 14 install, 13 Neoview Performance Analyzer, 11 Neoview Query Viewer, 12, 35 Neoview Query Workbench, 12, 89 Neoview Performance Analyzer Live View pane, 11 Neoview pane, 11 process boundaries, 99 Query Workbench pane, 11 start, 13 Triage Space pane, 11 Neoview platform, connect through ODBC, 22 Neoview Query Viewer Live View pane, 35 start, 13 Neoview Query Workbench Query Workbench pane, 89 start, 14 O Operators details, 99 ESP_EXCHANGE, 98 FILE_SCAN, 101 P Performance aggregate function, 101 base
W WMS workload aggregation statistics, 51 WMS configuration, save or export, 75 WMS Service Rules add admin role, 75 add compilation rule, 70 add connection rule, 68 add execution rule, 72 add rule, 67 alter existing, 73 associate rules to services, 73 character set support, 76 delete admin role, 75 delete rule, 73 manage admin roles, 74 manager, 65 rules summary, 66 WMS services add new services, 61 alter, 62 delete, 64 hold, 65 manage, 58 manage services user, 60 release, 65 start, 64 stop, 64 view or alt