
README for the HP Neoview Performance Analysis Tools (R2.4)


Connect to the previously configured client-side ODBC data source either by pressing the F5
key or selecting the Workspace menu Connect option. On Release 2.3 or later platforms, make
sure that you connect to the data source that was previously configured by HP Support to use
the service HP_QMGMT_SERVICE. When you are connected to the Neoview platform, the
Neoview Query Viewer automatically downloads a list of currently running queries and refreshes
itself on a pre-configured interval basis (the default is every 30 seconds for Release 2.3 or later
platforms and five minutes for Release 2.2 platforms).
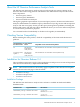
Configuring Neoview Query Viewer Options
To customize the Neoview Query Viewer options, use the Tools > Options menu to adjust the
settings. From the Options menu, you can set the following options:
ControlsThis option...
The number of seconds to wait for establishing a connection.Connection Timeout
The number of seconds to wait when executing any command. The default value is
600 (seconds). To ensure that query management actions execute correctly, do not set
this value to a value lower than 600.
Command Timeout
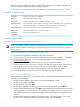
Whether times are displayed in the local client time zone or in the time zone where
the Neoview platform resides.
Show times in local time
zone
Whether SQL statements that are transaction boundaries (such as BEGIN/COMMIT
WORK or BEGIN TRANSACTION/END TRANSACTION) are retrieved and displayed.
Filters transaction boundaries. This option can also be controlled from the Live View
Options right-click menu.
Hide Transaction Bounds
Whether or not recently executed SQL statements (in the last minute) are also
downloaded and displayed along with currently running queries as per the repository.
This option can also be controlled from the Live View Options right-click menu.
Hide Completed Queries
Additionally, online help is available through the Help menu. Although the online help refers
to Triage Space instead of Neoview Query Viewer, the functionality is mostly the same, with the
exception of Workload Filters, which are available only in the Neoview Performance Analyzer.
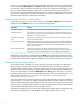
Customizing Neoview Query Viewer
To customize the list of columns you want to display, right click on the grid or on the tabular
listing of queries and select the Customize Grid Columns menu item. When you select the
Customize Grid Columns option, a dialog box appears that allows you to individually select or
deselect the list of columns of the list of running queries that you wish to display in tabular form.
Save your customized layout with the Workspace menu Save option. The layout is stored in
the Neoview Performance Analysis Tools installation directory. The layout is called default.wks
and is stored in this directory: C:\Program Files\Hewlett-Packard\Neoview
Performance Analysis Tools.
You can customize and set the refresh frequency on the right-click menu on the grid. The default
refresh frequency is 5 minutes for a Release 2.2 platform and 30 seconds for a Release 2.3 or later
platform (WMS-enabled). The right-click menu also shows the Live View Options shortcuts. This
controls whether completed SQL statements or SQL statements that are transaction boundaries
are downloaded and displayed in the Neoview Query Viewer.
The right-click menu allows you to select all the queries in the display (grid or tabular) and copy
the details to the clipboard. You and the DBA role can kill the queries that you own.
8