
Neoview Workload Management Services Guide (R2.4)

ROLE_NAME WARN_LEVEL START_TS ENTRY_TS
ENTRY_JTS LAST_UPDATED
----------------------------------------------------------------------------------------------------------------------------------------------------------------
----------- ------------------------------
------------------------------------------------------------------------------------------------
------------------------ ------------------------ ------------------------ ------------------------
------------------------ ------------------------ ------------------------ ------------------------
--------------- ---------------- ----------- -------------- -------------------- -----------------
------------- ---------------------- -------------------------- ---------------------------
------------------------ ------------------------ --------------------------------
----------------------------------------------------------------------------------------------------------------------------------------------------------------
-------------------------------------------------- ---------- --------------------------
-------------------------- -------------------- --------------------
MXID01002020782212110119447606071000000015509ROLE.USR200_498_S1
WAITING MAX_MEM_USAGE SERVICE1
358555.34319971694 358554.5719510814 0.10586772495516043 0.6653809105248738
0.39210000537675804 358555.34319971694 4.8382841521E10 834.43115234375
0 115724332 4 1 1 0 3
1 0 469.0 1876.0
1876.0 \WMS0102.$Z9M2 CLIENT-D530||NCI
ROLE.USR2 LOW 2009-05-27 12:36:45.300209 2009-05-27
12:36:45.300237 212110187805300237 212110187826330114
--- WMS operation complete.
NS%
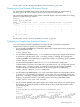
Each of the commands listed above displays the same columns of data in its output. For more
information, see Table A-11 (page 128).
For the syntax, see the “STATUS QUERIES Command” (page 127).
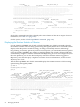
Displaying the Runtime Statistics of Queries
Use the STATUS QUERIES ALL STATS or STATUS QUERY ALL STATS command to display
the runtime statistics of all executing queries being managed by WMS. Those commands, which
display when the queries started executing, can help you manually monitor and manage
long-running, or runaway, queries. If you have not set up rules, you can identify runaway queries
using the STATUS QUERIES ALL STATS or STATUS QUERY ALL STATS command and then
cancel them by using the CANCEL command. If the Repository processes are configured on your
Neoview platform, you can also find each query with all its runtime statistics logged in a
Repository view after the query completes execution. For more information, see the Neoview
Repository User Guide.
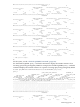
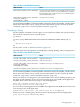
This STATUS QUERIES ALL STATS command displays the runtime statistics of all executing
queries being managed by WMS:
SQL>mode ns
NS%status queries all stats;
QUERY_ID
QUERY_STATE QUERY_SUBSTATE STATEMENT_ID
STATEMENT_TYPE COMP_START_TIME COMP_END_TIME EXEC_START_TIME
EXEC_END_TIME EXEC_STATE ELAPSED_TIME ACCESSED_ROWS USED_ROWS
MESSAGE_COUNT MESSAGE_BYTES STATS_BYTES DISK_IOS LOCK_WAITS
LOCK_ESCALATIONS PROCESS_BUSYTIME OPENS OPEN_TIME SQL_ERROR_CODE NUM_ROWS_IUD
STATS_ERROR_CODE SQL_SPACE_ALLOC SQL_SPACE_USED SQL_HEAP_ALLOC SQL_HEAP_USED SQL_CPU_TIME
EID_SPACE_ALLOC EID_SPACE_USED EID_HEAP_ALLOC EID_HEAP_USED TOTAL_MEM_ALLOC EST_ACCESSED_ROWS EST_USED_ROWS
PROCESSES_CREATED PROCESS_CREATE_TIME LAST_UPDATED
----------------------------------------------------------------------------------------------------------------------------------------------------------------
----------- ------------------------------
----------------------------------------------------------------------------------------------------------------------------------------------------------------
--------------------- -------------------- -------------------- -------------------- --------------------
--------------------- -------------------- -------------------- -------------------- --------------------
-------------------- -------------------- -------------------- -------------------- --------------------
-------------------- -------------------- -------------------- -------------- -------------------- ----------------
--------------- -------------- -------------- ------------- -------------------- --------------- --------------
-------------- ------------- --------------- ------------------------ ------------------------
-------------------- -------------------- --------------------
MXID01002020782212110119447606071000000015509ROLE.USR200_498_S1
EXECUTING S1
SELECT_NON_UNIQUE 212110212966002221 212110212966613506
212110213756193351 -1 FETCH 36974966 1407
1407 84 2464608 720 0
0 0 8336 4 4607 0
-1 0 11780 11552 16595 16429
196162 384 318 582 6 27981 1876.0
1876.0 8 89344 212110188631210751
72 Managing Workload