
Neoview Workload Management Services Guide (R2.4)

For the syntax, see the “ALTER WMS RESET STATS Command” (page 109).
Displaying the Total Number of Executing Queries
Use the STATUS QUERIES EXECUTING STATS command to display the total number of
executing queries in various states on each segment of the Neoview platform.
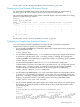
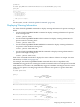
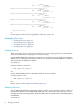
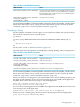
This STATUS QUERIES EXECUTING STATS command displays the total number of executing
queries in various states per segment:
SQL>mode ns
NS%status queries executing stats;
SEGMENT TOT_INITIAL TOT_OPEN TOT_EOF TOT_CLOSE TOT_DEALLOCATED TOT_FETCH TOT_CLOSE_TABLES
TOT_PREPARE
----------- ----------- ----------- ----------- ----------- --------------- ----------- ----------------
-----------
1 0 0 0 0 0 0 0
0
2 0 0 0 0 0 4 0
0
3 0 0 0 0 0 2 0
0
--- WMS operation complete.
NS%
For the syntax, see the “STATUS QUERIES Command” (page 127).
Displaying the Compile-Time Statistics of Queries
You can use different STATUS QUERIES or STATUS QUERY commands to display the
compile-time statistics of queries being managed by WMS:
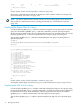
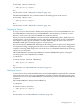
• Use the STATUS QUERIES ALL command to display the compile-time statistics of all queries
being managed by WMS:
STATUS QUERIES ALL;
• Use the STATUS QUERIES query-state command to display the compile-time statistics
of queries in a specified query state—executing, waiting, or holding. For example, this
STATUS QUERIES command displays compile-time statistics of all holding queries in WMS:
STATUS QUERIES HOLDING;
• Use the STATUS QUERIES SERVICE service-name command to display the
compile-statistics of queries associated with a specified service. You can optionally specify
the query state—executing, waiting, or holding. For example, this STATUS QUERIES
command displays compile-time statistics of all executing queries in SERVICE1:
STATUS QUERIES SERVICE service1 EXECUTING;
• Use the STATUS QUERIES ROLE role-name command to display the compile-time statistics
of queries associated with the specified role or user name. You can optionally specify the
query state—executing, waiting, or holding. For example, this STATUS QUERIES command
displays compile-time statistics of all waiting queries associated with ROLE.USER:
STATUS QUERIES ROLE ROLE.USER WAITING;
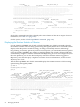
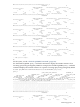
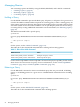
• Use the STATUS QUERY command to display the compile-time statistics of a specific query.
For example, this STATUS QUERY command displays the compile-time statistics of the
specified query ID:
SQL>mode ns
NS%status query MXID01002020782212110119447606071000000015509ROLE.USR200_498_S1;
QUERY_ID
QUERY_STATE QUERY_SUBSTATE
SERVICE_NAME EST_COST
EST_CPU_TIME EST_IO_TIME EST_MSG_TIME EST_IDLE_TIME
EST_TOTAL_TIME EST_CARDINALITY EST_TOTAL_MEM EST_RESRC_USAGE
CMP_AFFINITY_NUM CMP_DOP CMP_TXN_NEEDED CMP_MANDATORY_X_PROD CMP_MISSING_STATS CMP_NUM_JOINS
CMP_FULL_SCAN_ON_TABLE CMP_HIGH_DP2_MAX_BUF_USAGE CMP_ROWS_ACCESSED_FULL_SCAN CMP_DP2_ROWS_ACCESSED
CMP_DP2_ROWS_USED PROCESS_NAME QUERY_NAME
Monitoring Queries 71