
Neoview System Monitor Quick Start (R2.3 SP3, R2.4)

NOTE: Changes to the threshold settings have no effect if the aggregation options on the Data
Options tab are set to No Aggregation or Average Segments:
To change a standard deviation threshold:
1. From the setup screen, make sure that the options are displayed, as described in “Display
the Options Tabs on the Setup Screen” (page 16).
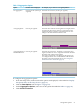
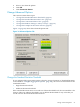
2. Click the Advanced Options tab. See Figure 1-6 (page 25).
3. Enter a value for the High deviation or Moderate deviation threshold.
4. Click Connect to server.
Change the Standard Deviation Bar Color
Bar-color buttons for the standard deviation settings let you control the color of the bar when
the standard deviation exceeds the low, moderate, and high thresholds.
To change the standard deviation bar colors:
1. From the setup screen, make sure that the options are displayed, as described in “Display
the Options Tabs on the Setup Screen” (page 16).
2. Click the Advanced Options tab. See Figure 1-6 (page 25).
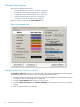
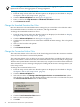
3. Click the bar-color button for one of the three standard deviation settings. The color palette
appears.
4. Select a color from the color palette.
5. Click OK.
6. Click Connect to Server.
Change the Connection Failure Color
The connection failure color is the color of the chart background when the connection with the
server is lost. This feature is turned off by default.
The connection failure color can help you recognize when the data provided by the client is no
longer valid. When a connection is lost, the connection failure color is activated (if configured).
The Neoview System Monitor retries the connection every couple of seconds for about 10 minutes.
After 10 minutes, an error message is displayed. Clicking OK in the error message returns you
to the setup screen.
To change the connection failure color:
1. From the setup screen, make sure that the options are displayed, as described in “Display
the Options Tabs on the Setup Screen” (page 16).
2. Click the Advanced Option tab.
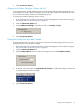
3. Select the check box for Change chart background colors on connection lost. (When
this check box is cleared, the chart background stays the same color on connection lost, and
the Lost Connection Color button is deactivated.)
4. Click the Lost Connection Color button.
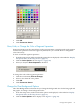
5. Select a color from the palette.
6. Click OK.
26 Start and Use the HP Neoview System Monitor