
Neoview System Monitor Quick Start (R2.3 SP3, R2.4)
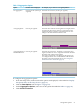
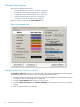
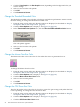
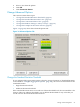
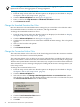

Table 1-3 Aggregation Options
For example, if you connect to a 4-segment platform . . . .Number of Bars DisplayedOption
The client shows 64 bars (16 CPUs per segment).One bar per CPU (16 bars per
segment).
No Aggregation
The client shows four bars. Each segment is averaged, and the
bar represents the average value for a given metric for the
segment. If a metric exceeds it's 100% setting, the bar color
changes to the Threshold Exceeded bar color.
One bar per segment.Average Segments
The client shows four bars. The metric is averaged for each
segment, and the bar color is assigned based on the standard
deviation of the values in that segment.
This option overrides the color settings for the graphs. You
can configure the bar colors and threshold for the standard
deviation on the Advanced Options tab. See “Change the
Standard Deviation Threshold” (page 25).
One bar per segment.Average Segments w/
Standard Deviation
To configure the aggregation options:
1. From the setup screen, make sure that the options are displayed, as described in “Display
the Options Tabs on the Setup Screen” (page 16).
2. Click the Data Options tab. See Figure 1-4 (page 17).
3. Under Aggregation Options, select one of the options described in Table 1-3 (page 21).
4. Click Connect To Server.
Change Data Options 21