
Neoview System Monitor Quick Start (R2.3 SP3, R2.4)
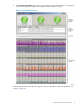
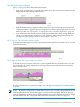
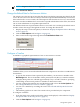

3. Under the Metric column, select the Timeline check box to display the timeline graph.
4. Under the Timeline column, select a check box for each metric that you want to add to the
timeline.
5. In the Max Range field, enter the number of data points that you want the timeline to
capture. Multiplying this number by 2 yields the approximate duration of the timeline in
seconds. For example, specifying a Max Range of 25 creates a timeline of approximately 50
seconds.
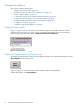
6. Click Connect To Server.
To change the color of a timeline, see “Change the Bar/Line Colors for a Metric” (page 22).
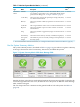
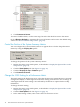
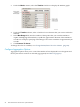
Configure Aggregation Options
Aggregation options allow you to control the number of bars displayed for each segment and
the way the data for each bar is collected (aggregated). See Table 1-3 (page 21).
20 Start and Use the HP Neoview System Monitor