
Neoview System Monitor Quick Start (R2.3 SP3, R2.4)
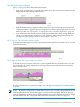

4. Click Connect to Server.
To restore a hidden metric, use the same steps, but select the check box next to the metric:
Or click Restore Defaults to automatically restore all metrics and revert to the default setup
values. See “Restore Default Setup Values” (page 33).
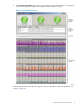
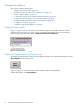
Control the Position of the System Summary Metrics
You can configure the system summary metrics to appear above or below the performance
metrics by using the Display On options:
To change the position of the system summary metrics:
1. Display the setup screen with options, as described in “Display the Options Tabs on the
Setup Screen” (page 16).
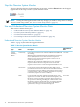
2. Click the Data Options tab. See Figure 1-4 (page 17).
3. Click the Display On Top or Bottom option.
4. Click Connect to Server.
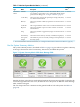
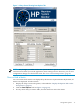
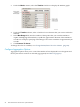
Change the 100% Setting for a Performance Metric
The 100% setting is the highest non-error value that the Neoview System Monitor is currently
configured to display. A value higher than the 100% setting causes the bar color to change. A
value higher than the 100% setting is not reflected by the bar but is captured in the tooltip
information.
To change the 100% setting:
1. Display the setup screen with options, as described in “Display the Options Tabs on the
Setup Screen” (page 16).
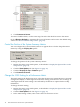
2. Click the Data Options tab. See Figure 1-4 (page 17).
3. In the 100% Setting column, enter a new value of 8 characters or less.
18 Start and Use the HP Neoview System Monitor