
Neoview System Monitor Quick Start (R2.3 SP3, R2.4)

Use the Performance Metrics
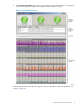
Figure 1-2 (page 11) shows the performance metrics.
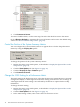
• Each metric is displayed in a separate row with a footer. The footer shows the name of the
metric and the 100% setting in parentheses:
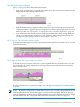
• With the default settings applied, each bar represents a processing node (CPU), and each
column represents a segment. You can change the color of the segment separators or remove
them if you like. See “Show, Hide, or Change the Color of Segment Separators” (page 23).
• A bar turns black (the default color for threshold exceeded) if the 100% setting defined at
startup is exceeded. If this happens too often, adjust the 100% setting during setup. See
“Change the 100% Setting for a Performance Metric” (page 18).
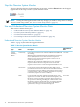
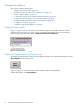
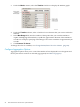
Use Tooltips to Get Information About a Metric
To obtain a brief description of a metric and check the data refresh rate, hold the cursor over the
footer for the metric:
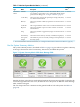
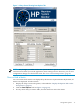
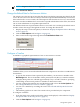
Use Tooltips to Show the Current Value of a Metric
To obtain the current value of a metric for a given segment and CPU, hold the cursor over the
bar for the CPU. A tooltip caption shows the approximate value of the bar at the instant the
cursor moved over it:
To change the font size or contrast of tooltips, see “Change the Tooltip Font Size and Contrast”
(page 27).
NOTE: By default, tooltip data is refreshed about once every 2 seconds. Bar graph data has the
same default refresh rate, but the bars appear to refresh more frequently. This is because the
software implements gradual changes in the bar height to prevent a flickering display. To change
the data refresh rate, see “Change the Refresh Rate for Performance Metrics” (page 19).
Use and Understand Neoview System Monitor Data 15