
Neoview System Monitor Quick Start (R2.3 SP3, R2.4)
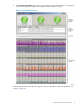
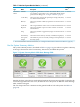
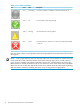
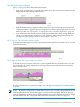
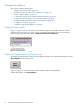
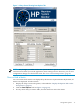
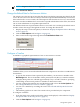
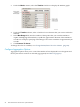

Table 1-1 Neoview System Monitor Metrics (continued)
Default Refresh
Rate
1
DescriptionMetricType
2 secondsA graph of a given metric over time. The timeline allows you to
see a trend for a given metric over a configurable number of data
points (the Max Range). See “Configure a Timeline” (page 19).
TimelinePerformance
Metric
2 secondsThe average busy value of the specified processing node (CPU)
over the last refresh interval.
% CPU Busy
2 secondsThe average number of disk I/O operations over the last refresh
interval.
Disk I/O
2 secondsThe average number of cache accesses over the last refresh intervalCache Hits
2 secondsThe average number of process-context switches over the last
refresh interval.
Dispatch
2 secondsThe average number of page faults (swaps) over the last refresh
interval.
Swap
2 secondsThe amount of free memory currently available (in megabytes).Free Memory
2 secondsThe number of processes currently waiting to be dispatched (on
the ready queue).
CPU Queue
Length
1 For more information about the refresh rate, see “Change the Refresh Rate for Performance Metrics” (page 19).
Use the System Summary Metrics
The system summary metrics, described in Table 1-1 (page 12), provide an at-a-glance summary
of the up or down state of the Connectivity, Transaction, and Disk subsystems:
Figure 1-3 System Summary Metrics With Status Message Table
Initially, the three colored icons are displayed without the status-message table. To display the
status-message table below the icons, click the tab for a subsystem. To hide the status-message
table, click the tab again.
The icon shape and color communicate the general health of each subsystem. See Table 1-2
(page 14).
Use and Understand Neoview System Monitor Data 13