HP Neoview System Monitor Quick Start HP Part Number: 531834-001 Published: April 2009 Edition: HP Neoview Release 2.4 (Client Update 1 for Release 2.
© Copyright 2009 Hewlett-Packard Development Company, L.P. Legal Notice Confidential computer software. Valid license from HP required for possession, use or copying. Consistent with FAR 12.211 and 12.212, Commercial Computer Software, Computer Software Documentation, and Technical Data for Commercial Items are licensed to the U.S. Government under vendor’s standard commercial license. The information contained herein is subject to change without notice.
Table of Contents About This Document.........................................................................................................7 Supported Releases.................................................................................................................................7 Publishing History..................................................................................................................................7 New or Changed Information in This Edition...........................
A Neoview Documentation.............................................................................................37 Where to Find Neoview Documentation..............................................................................................37 Neoview Customer Library..................................................................................................................37 Index..................................................................................................................
List of Figures 1-1 1-2 1-3 1-4 1-5 1-6 1-7 Setup Screen (With Options Hidden)............................................................................................10 System Monitor Screen..................................................................................................................11 System Summary Metrics With Status Message Table..................................................................13 Setup Screen Showing Data Options Tab..............................................
List of Tables 1-1 1-2 1-3 2-1 6 Neoview System Monitor Metrics.................................................................................................12 Icon Colors and States...................................................................................................................14 Aggregation Options.....................................................................................................................21 Connection Problems.................................................
About This Document This quick start describes how to get started using the HP Neoview System Monitor product. This quick start is written for users who manage or monitor a Neoview platform. For more information about the Neoview platform, see Appendix A (page 37). Supported Releases This quick start supports HP Neoview Release 2.4 and all subsequent releases unless it is replaced by a newer edition.
1 Start and Use the HP Neoview System Monitor This chapter contains these main topics: • • • • • • • • • • “Welcome to the HP Neoview System Monitor” (page 9) “Install the Neoview System Monitor Client Application” (page 9) “Start the Neoview System Monitor” (page 10) “Stop the Neoview System Monitor” (page 12) “Use and Understand Neoview System Monitor Data” (page 12) “Change Data Options” (page 16) “Change Color Options” (page 22) “Change Advanced Options” (page 25) “Record and Play Back a Session” (page
Start the Neoview System Monitor To start the Neoview System Monitor, use the Start menu: 1. Click Start→All Programs→HP Neoview System Monitor→HP Neoview System Monitor. NOTE: Alternately, you can double-click the NeoSysMon.exe executable file in the installation folder or a shortcut to the executable file. The default location for the installation folder is: C:\Program Files\Hewlett-Packard\HP Neoview System Monitor\ The setup screen is displayed: Figure 1-1 Setup Screen (With Options Hidden) 10 2.
4. Click Connect to Server to start the system monitor. The system monitor screen appears, and the client begins to display data using the default display settings. Figure 1-2 System Monitor Screen If the system monitor screen does not appear, or if you experience connection problems, see Chapter 2 (page 35).
Stop the Neoview System Monitor To stop (close) the Neoview System Monitor at any time, click the Close button in the upper right corner of the setup screen or system monitor screen: NOTE: Closing the client application discards any changes you made to setup values or settings. To save custom setup values, see “Save Custom Setup Values” (page 31).
Table 1-1 Neoview System Monitor Metrics (continued) Type Metric Performance Timeline Metric 1 Default Refresh Rate1 Description A graph of a given metric over time. The timeline allows you to 2 seconds see a trend for a given metric over a configurable number of data points (the Max Range). See “Configure a Timeline” (page 19). % CPU Busy The average busy value of the specified processing node (CPU) over the last refresh interval.
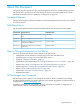
Table 1-2 Icon Colors and States Icon Color State Description Gray Connecting The client is waiting to establish a connection with the server. Green Up The subsystem is operating normally. Yellow Warning The subsystem has a minor problem. Red Down The subsystem has a critical error. At least one component has failed or is down. If an icon turns yellow or red, check the status-message table for more information, and contact HP support.
Use the Performance Metrics Figure 1-2 (page 11) shows the performance metrics. • Each metric is displayed in a separate row with a footer. The footer shows the name of the metric and the 100% setting in parentheses: • With the default settings applied, each bar represents a processing node (CPU), and each column represents a segment. You can change the color of the segment separators or remove them if you like. See “Show, Hide, or Change the Color of Segment Separators” (page 23).
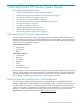
Change Data Options This section contains these topics: • “Display the Setup Screen” (page 16) • “Display the Options Tabs on the Setup Screen” (page 16) • “Show or Hide a Metric” (page 17) • “Control the Position of the System Summary Metrics” (page 18) • “Change the 100% Setting for a Performance Metric” (page 18) • “Change the Refresh Rate for Performance Metrics” (page 19) • “Configure a Timeline” (page 19) • “Configure Aggregation Options” (page 20) Display the Setup Screen Figure 1-1 (page 10) shows
Figure 1-4 Setup Screen Showing Data Options Tab NOTE: Any changes you make to Neoview System Monitor options are retained only for the current session. When you exit the application, these settings are lost. However, you can save configuration changes to a file for later reuse. See “Save Custom Setup Values” (page 31). Show or Hide a Metric You can control which metrics are displayed by the Neoview System Monitor. By default, all metrics are displayed. To hide a metric: 1. 2. 3.
4. Click Connect to Server. To restore a hidden metric, use the same steps, but select the check box next to the metric: Or click Restore Defaults to automatically restore all metrics and revert to the default setup values. See “Restore Default Setup Values” (page 33). Control the Position of the System Summary Metrics You can configure the system summary metrics to appear above or below the performance metrics by using the Display On options: To change the position of the system summary metrics: 1. 2.
NOTE: 4. Negative values are not supported. Click Connect to Server. Change the Refresh Rate for Performance Metrics The refresh rate is the amount of time that the client waits before requesting new data from the server. However, the server does not always return the requested data immediately. For instance, if the refresh rate is set to 5 seconds, the client requests data from the server every 5 seconds. But the server can take an additional 2 to 4 seconds to respond with the data.
3. Under the Metric column, select the Timeline check box to display the timeline graph. 4. Under the Timeline column, select a check box for each metric that you want to add to the timeline. In the Max Range field, enter the number of data points that you want the timeline to capture. Multiplying this number by 2 yields the approximate duration of the timeline in seconds. For example, specifying a Max Range of 25 creates a timeline of approximately 50 seconds. Click Connect To Server. 5. 6.
Table 1-3 Aggregation Options Option Number of Bars Displayed For example, if you connect to a 4-segment platform . . . . No Aggregation One bar per CPU (16 bars per The client shows 64 bars (16 CPUs per segment). segment). Average Segments One bar per segment. The client shows four bars. Each segment is averaged, and the bar represents the average value for a given metric for the segment. If a metric exceeds it's 100% setting, the bar color changes to the Threshold Exceeded bar color.
Change Color Options This section contains these topics: • • • • • “Change the Bar/Line Colors for a Metric” (page 22) “Change the Chart Background Options” (page 23) “Change the Threshold Exceeded Color” (page 24) “Change the Mouse-Over Bar Color” (page 24) “Change the CPU Down Bar Color” (page 24) Figure 1-5 (page 22) shows the Color Options tab: Figure 1-5 Color Options Tab Change the Bar/Line Colors for a Metric The Bar/Line Color buttons let you customize the colors for the displayed bar and line gr
5. 6. Click OK. Click Connect to Server. Show, Hide, or Change the Color of Segment Separators Segment separators are the vertical lines on the system monitor screen that mark each segment in a Neoview platform. These lines appear by default, but you can hide them or change their color if necessary. To show or hide the segment separators: 1. 2. 3. From the setup screen, make sure that the option tabs are displayed, as described in “Display the Options Tabs on the Setup Screen” (page 16).
3. 4. 5. 6. Click the Line Graph or the Bar Graph button, depending on the background color you want to change. Select a color from the color palette. Click OK. Click Connect to Server. Change the Threshold Exceeded Color The threshold exceeded color is the bar color that is used when a performance metric exceeds the 100% setting. To change the threshold exceeded color: 1. 2. 3.
4. 5. 6. Select a color from the palette. Click OK. Click Connect to Server.
NOTE: Changes to the threshold settings have no effect if the aggregation options on the Data Options tab are set to No Aggregation or Average Segments: To change a standard deviation threshold: 1. 2. 3. 4. From the setup screen, make sure that the options are displayed, as described in “Display the Options Tabs on the Setup Screen” (page 16). Click the Advanced Options tab. See Figure 1-6 (page 25). Enter a value for the High deviation or Moderate deviation threshold. Click Connect to server.
7. Click Connect to Server. Change the Window Setting to “Always on Top” To give the Neoview System Monitor greater priority among other desktop applications, you can configure the client window to display on top of all other windows. In this mode, the only way to remove the client window is to minimize or close it. To change the window setting to always on top: 1. 2. 3.
Record and Play Back a Session This section contains these topics: • • • “Record a Session” (page 28) “Stop Recording” (page 29) “Play Back a Session” (page 29) Figure 1-7 (page 28) shows the Tracing/Playback tab: Figure 1-7 Tracing/Playback Tab Record a Session When you record a session, the Neoview System Monitor records all data associated with the session. You do not need to modify any setup values before starting a recording.
Quick Recording Method 1. 2. In the system monitor screen (see Figure 1-2 (page 11)), right-click anywhere, and select Start Recording. The Save Recording dialog box appears. Specify a file name. NOTE: 3. You do not need to specify a file type. The session is saved as a binary file. Click Save. The recording starts immediately and continues until you stop the recording manually. To stop the recording, see “Stop Recording” (page 29). Precision Recording Method 1. 2. 3. 4.
3. 4. 5. Under Playback, in the File name field, specify a file name of a previously recorded session. Or click the Browse button to select from a list of recorded files. Click the Begin Playback button. When the recording limit is reached, the application displays a dialog box to notify you. To stop playback before the recording limit is reached and return to the Tracing/Playback tab, right-click anywhere in the system monitor screen and select Setup Neoview System Monitor.
Save and Use Custom Setup Values This section contains these topics: • • • • “Save Custom Setup Values” (page 31) “Load Saved Custom Setup Values” (page 31) “Load Custom Setup Values Automatically at Startup” (page 31) “Restore Default Setup Values” (page 33) Save Custom Setup Values Any changes you make to Neoview System Monitor setup values are retained only for the current session. When you exit the application, these settings are lost.
4. 5. Click the Shortcut tab to display it. In the Target field, append the file path of the .nsf file that you want to load at startup of the client application. You must add the path after the existing target in double quotes and enclose the path itself in double quotes. The file path is the relative path of the .nsf file from the Neoview System Monitor executable. For example, if the .nsf file is called DefaultSettings.
For example, if you want to load the default settings file on the C: drive, but you do not want to autoconnect, specify a Target entry like this: 6. 7. Click OK to save your changes to the shortcut. Double-click the shortcut to load the specified .nsf file automatically. You can repeat these steps to create multiple shortcuts for access to different platforms with preconfigured settings.
2 Troubleshoot and Uninstall the Neoview System Monitor Table 2-1 (page 35) shows some common connection problems and steps you can take to resolve them: Table 2-1 Connection Problems Problem Possible Causes Troubleshooting Steps The client returns a • An incorrect server name, IP, or port 1. Check the server name and IP address “connection failed” message. number was specified. that you specified for the connection. • The server component is not running. 2. Check to make sure that the server is running.
A Neoview Documentation Where to Find Neoview Documentation To find out more about the Neoview Platform, see the HP Web site for Business Intelligence at: http://docs.hp.com/en/busintellsol.html Neoview Customer Library This quick start is part of the Neoview customer library. The manuals in the Neoview customer library are listed here for your convenience.
Neoview Repository User Guide Information about using the Repository, including descriptions of Repository views and guidelines for writing Neoview SQL queries against the views. Neoview System Monitor Quick Start Instructions for starting, using, customizing, and troubleshooting the Neoview System Monitor. Neoview Workload Management Information about using Neoview Workload Management Services (WMS) to Services Guide manage workload and resources on a Neoview data warehousing platform.
Index Symbols H $MXAS2, 12 $MXOAS, 12 % CPU Busy, 13 .
Server Port information, 10 Session playing back, 29 recording, 28 stop recording, 29 Settings, persistence of, 17, 31 Setup screen, 10, 16 Setup values, 33 Show Options button, 16 Show/hide separators, 23 Software depot, 9 Standard deviation bar color, 26 Standard deviation threshold, 25 Startup, customizing, 31 Status message table, 11, 13, 14 Supported releases, 7 Swap, 13 System Monitor Screen, 11 System summary metrics, 9, 12, 13, 18 T Threshold exceeded, 15, 24 Timelines, 9, 13, 19 Tooltips display o