
Neoview Management Dashboard Client Guide for Database Administrators (R2.4)
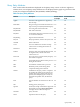
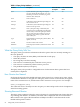
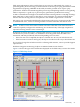
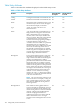

Table entity information can be useful when you are trying to understand why a query is
performing badly, because missing or obsolete statistics can cause poor query performance. Table
fragmentation (requiring a REORG on the table) is another possible cause of poor query
performance. It follows that monitoring tables proactively, and updating statistics or reorganizing
tables as required, is a good way to prevent query performance problems from arising.
A table or materialized view begins to be monitored when a missing statistics event (SQL warnings
6007, 6008, 6010, or 6011) refers to that table or view. Thereafter, it is monitored until fifteen
minutes after the missing statistics are updated or the needed reorganization is achieved.
HP support can customize the Dashboard configuration (on the server) to monitor specific tables
or materialized views, even if no missing statistics event has referred to the table or view.
NOTE: A table or view whose name contains characters other than 7–bit ASCII characters
cannot be explicitly configured for monitoring. It is monitored only of the SQL compiler has
reported a missing statistics event concerning it.
By default, the refresh interval for collecting table statistics is 60 seconds. Reorg status is not
checked at every interval; rather, it is checked for an existing table when the table is first
monitored, and then periodically afterward depending on its last state:
• If the last state was Completed, the object is checked once in every 60 refresh intervals.
• If the last state was None or In Progress, the object is checked once in every 5 refresh intervals.
If you wish to change the refresh intervals for collecting table statistics, contact your HP Support
representative.
Dashboard supports monitoring of objects in 2000 and 2300 version schemas.
Figure 6-6 shows the types of the information displayed on the Table entity screen in Sort mode.
Figure 6-6 Table Entity Screen
Table Entity 99