
Neoview Management Dashboard Client Guide for Database Administrators (R2.4)
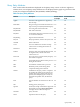
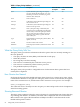
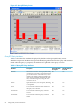
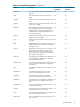
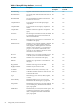
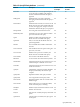
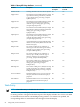
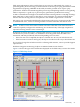
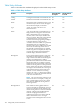

Table 6-4 Query Entity Attributes (continued)
Default Attribute for
Grid?
Default Attribute
for Graph?
DescriptionAttribute
YesYesSystem utilization percentage for all query
processes during the last interval. Sys% only
includes processes for which Busy is greater
than the value of BusyVal.
Sys%
YesNoTime of statistics.Time
NoNoCumulative system utilization percentage for
the connection server .
TotCon%
YesYesCumulative system utilization percentage for
all the executor processes.
TotEsp%
YesYesTotal system percentage consumed by the
connection server and the ESPs since the query
started. TotSys% takes the QSECS parameter
into account and only includes processes for
which the value of Busy is greater than the
value of BusyVal.
TotSys%
YesNoSQL statement type of the query (Insert, delete,
update, or select).
Type
YesNoThe alias name for the user ID.UserID
YesYesTime elapsed, in minutes, from the start of the
query.
WallTime
What the Query Entity Tells You
The Query entity provides this information about the queries that are currently running on a
Neoview platform:
• The query ID, data set name (DSN), and Client ID of each query
• When they started
• How long they have been running
• The resources consumed by the connection server process
• The resources consumed by all the executor processes
• The parallelism (skew) of the query
The Query entity also provides a configurable view of information about queries that have
recently been completed.
How Queries Are Named
Each query displayed on the Dashboard Query Entity Screen has a unique query name, which
is listed under “Domain” in the grid area. The query name consists of a user name, the segment
name of the connection server, and the name of the connection server process. For example:
Acnum_read\Hpq0101\$Y1wy
The connection server currently executes one query at a time and provides a level of uniqueness
suited for naming queries.
Showing Removed Queries
The Query entity continues to display removed queries for a specified amount of time after they
stop running (the default is 15 minutes.) The time value is displayed and set from the Delete
Removed list to the right of the Show Removed Objects checkbox on the General tab in the
Dashboard Properties window.
92 Using Entity Screen Information