
Neoview Management Dashboard Client Guide for Database Administrators (R2.4)
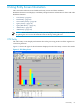
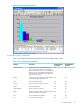

CPU Entity Attributes
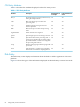
Table 6-1 describes the attributes displayed on the CPU entity screen.
Table 6-1 CPU Entity Attributes
Default Attribute for
Grid?
Default Attribute
for Graph?
DescriptionAttribute
YesYesPercentage of the processing node that is busy
during the sample interval.
Busy%
YesYesDisk cache hit rate per second for the
processing node.
Chit
YesNoNumber of the processing node on the
Neoview platform.
Cpu
YesNoDisk I/O rate per second for the processing
node.
Disk
YesNoName of the Neoview segment.SegmentName
YesYesQueue length of processes waiting to execute.Queue
YesYesOperational status of the processing node. A
green Up icon signifies the processing node is
up with thresholds. A red Down icon signifies
the processing node is down.
Status
YesYesMemory manager page fault rate in page faults
per second.
Swap
YesNoTime of statistics. A red Down icon signifies
that the time is outside the sampling interval.
Time
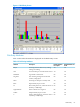
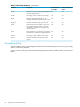
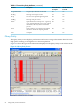
Disk Entity
The Disk entity screen displays information about the disks on all the segments in a Neoview
platform.
Figure 6-2 shows the types of the information displayed on the Disk entity screen in Sort mode.
86 Using Entity Screen Information