
Neoview Management Dashboard Client Guide for Database Administrators (R2.4)
Select ALL to remove the limit altogether. However, selecting ALL can lead to performance
degradation when you display a large number of objects or rows.
High Contrast Check Box
When the Dashboard client is installed on a workstation for the first time, the background color
for entity screens is gray. When the Dashboard client is installed on a workstation where it has
been installed before, the background color for entity screens depends on the setting if this check
box.
Select the High Contrast check box if you want to maximize color contrast between graph
elements and the graph background, that is, if you want the background color to be black, rather
than gray. If you prefer less contrast, clear this check box.
Show Wall Check Box
If you want contrast between the graph wall and the graph background, select the Show Wall
check box. If you prefer less contrast, clear this check box.
Save Rotate Angles Check Box
To permanently save graph rotation and elevation angles each time you rotate the graph in the
main Browse window, select the Save Rotate Angles check box.
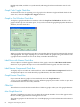
Icon Server Control Panel
The Icon Server control panel lets you configure the icons and colors that appear in Dashboard,
OIL, and OEM windows.
To display the Icon Server control panel, click the Icons button on the General Property Sheet.
You can also use this control panel to configure your own customized icons and colors for the
Dashboard environment.
To select a set of icons and colors, select New Icon Directory? to change your icon directory.
OK or Apply buttons are enabled when the directory you select is a valid icon-color directory.
To apply the changes to your Dashboard environment, click OK or Apply. If you do not want
to change anything, click Cancel.
To change the color associated with a state, select the colored state name in the colored states
area on the right side of the control panel. A color palette for the selected state appears. Select
the color you want to associate with the state. To apply icon and color changes, click OK or
Apply.
For more information about configuring your own icons and colors, click the Help button on
the Icon Server control panel.
OEM Property Sheet
The OEM property sheet controls how segments, entities, and objects are displayed in the Open
Enterprise Management (OEM) gateway. Also use this property sheet to control the display of
availability and performance icons.
Enable the OEM gateway when you want an enterprise management gateway view of segments,
entities, and objects known to Dashboard. When you select an entity or object in the OEM
framework, Dashboard reports on the selected segment, entity, or object.
Performance utilization and alert icons representing the relative state of segment, entities, and
objects can also be displayed in the OEM. Icons are automatically propagated upward through
the OEM hierarchy. This propagation algorithm ensures that even when the OEM hierarchy is
collapsed, the highest alerts for segments, entities, or objects are visible.
Icon Server Control Panel 69