
Neoview Management Dashboard Client Guide for Database Administrators (R2.4)

Dashboard, OEM, and OIL are synchronized, indicating the relative utilization state of each
object.
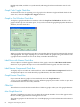
Graph Color Toggle Check Box
To alternate the color of repeating rows of graph colors between a light and dark shade of the
same color, select the Graph Color Toggle check box.
Graph in Grid Window Check Box
To display a graph in the Browse window, select the Graph in Grid Window check box. The
graph can take up a lot of monitor space, so if you do not want the graph displayed in the Browse
window, clear this check box.
When you select an item in the graph, the corresponding data in the grid is automatically selected
and highlighted. This tight coupling lets you work in either the graph or the grid and have both
a graphical and a numerical view of the entity available simultaneously.
Label Rows with Names Check Box
To have object row labels appear at the base of the graph, select the Label Rows with Names
check box. If you prefer the object rows to be identified with a legend, clear this check box.
Label Names Compressed Check Box
To display object row labels in condensed form, select the Label Names Compressed check box.
To display the object rows with their fully expanded name, clear this check box.
Graph Percent Check Box
If you want the data in graphs to be normalized, select the Graph Percent =
value/Graph-Max*100 check box. Use the Attribute property sheet tab to set the Graph-Max
normalization value for each entity attribute.
Offset List
The Offset list controls the horizontal offset of labels in graphs when you click graph elements.
Max Graph Rows List
The Max Graph Rows property lets you limit the maximum number of rows that appear in the
Browse window graph and associated grid or list view.
The primary purpose of this function is to avoid displaying too much information in the Browse
window.
68 Using the Client Property Sheets