
Neoview Management Dashboard Client Guide for Database Administrators (R2.4)
Clear Registry Button
To clear all of your registry settings, click the Clear Registry button. Because all existing settings
are lost, a confirmation dialog box appears. Custom Dashboard configuration settings are also
lost, and Dashboard reverts to default settings. If you click Yes, all settings are cleared, the
Dashboard Client terminates, and you must restart your Dashboard session. You can configure
your new settings when the session is restarted. Click No to close the confirmation dialog box
and leave your settings unchanged.
Command Wizard Check Box
To enable the Command Wizard, select the Command Wizard check box. This feature is intended
for use by HP Support.
Data Query Tool Bar Enable Check Box
To display the toolbar in the main Browse window, select the Data Query Tool Bar Enable check
box.
Icons Button
Click the Icons button on the General property sheet to configure the icons and colors you want
to represent objects and states in Dashboard, OIL, and OEM windows.
When you click the Icons button, the Icon Server control panel appears. The Icon Server lets you
configure your icons and colors. For information on using this control panel, see “Icon Server
Control Panel” (page 69).
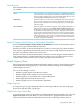
New Graph on Data Grid Double Click Check Box
To change the default double-click behavior in the grid portion of the main Browse window,
select the New Graph on Data Grid Double Click check box.
When you select this check box, double-clicking selected rows in the grid portion of a Browse
window opens a new Graph window view of the selected object or objects.
When this check box is cleared, double-clicking the grid portion causes the selected row or column
to be graphed in the same window as the grid. Use this option to isolate the graphic properties
of the selected row or column.
You can also access these functions through the grid menu by right-clicking a grid row, column,
or cell and then selecting either New Graph to display a new graph in a new window or Graph
Row/Column to display the selected row or column in the graph portion of the same window.
Reports Auto Refresh Check Box
To automatically refresh the contents of Report windows whenever Dashboard performs a host
sample update, select the Reports Auto Refresh check box.
When this check box is cleared, Report windows are static, displaying data for the specific request
that initially created the Report window. This data is not updated.
Clicking the Auto Refresh Indicator in the lower left corner of a Report window also controls
the Auto Refresh property for that window. When you click the Auto Refresh Indicator, a menu
appears so that you can specify the setting of the Auto Refresh property. You can also manually
update the window using the menu.
Set Password Button
Click the Set Password button to protect Dashboard property sheets with a password. The Set
Password dialog lets you password-protect the settings for your environment. Click the Set
Password button on the General property sheet to display the Set Password dialog box.
General Property Sheet 65