
Neoview Management Dashboard Client Guide for Database Administrators (R2.4)
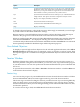


DescriptionOption
Controls the measurement interval in seconds. If you are comparing data to
Dashboard, use the same sample interval as Dashboard, which is the default.
Otherwise, you can pick a shorter or longer interval. You are limited to one
measurement at a time to protect the use of system resources.
Seconds
Synchronizes the measurement to start and stop in sync with the Dashboard
sample interval. This option can used for comparative analysis of stats.
Sync
Displays raw output, most likely not desired.Raw
Starts the measurement and analysis.Start
Cancels the Show Related Measurement dialog box.Cancel
Displays online help.Help
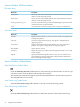
To display advanced options, select the down arrow. HP strongly recommends you not change
any of the values for the advanced Measure settings.
Reports appear in a normal Dashboard report window and are tiled along with other report
windows. The progress bar at the bottom shows measurement status and details.
When you click the Status Bar portion of a Show Related Measurement report window, the menu
items named Correlate as … are displayed. Selecting one of these menu items will show a
correlation analysis between the measurement and Dashboard data. Correlate as is an advanced
feature primarily intended for Dashboard QA and development purposes.
Show Related Objectives
To display a report of high and low objectives for the selected application domain, select Show
Related Objectives. When this report is generated, a query is posted to your host system. Then
the response appears in a scrollable view of Application domain objectives related to the selected
object.
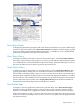
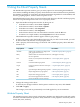
Session Window
Dashboard obtains object status and performance information via an active Host session to a
Neoview platform. Using the Session window, you can view, start, stop, and track the progress
of your Host Session. You can also synchronize the time and date between your workstation and
the server.
To open the Session window, select View > Session in the Browse window or click the Host icon
in the PC-Host Session Status display.
Session Log
You can view the progress of your Dashboard Host Session from the Session window. All Host
Session establishment and I/O activities appear in the log area of the Session window.
The Session log is useful for checking the status of your Host Session. If you are having difficulty
with your Host Session, view the Session log to determine the cause. The log always contains
the latest information about your host dialog, including version information about the CSG, SSG,
and SeeView products.
To save the Session log to disk, select File Save from the Session window.
Session Window 55