
Neoview Management Dashboard Client Guide for Database Administrators (R2.4)


Show Related Disks
To display a report of disk volumes related to the selected object, select Show Related Disks.
When this report is generated, a query is first posted to your host system and the response appears
in a scrollable view of disk volume performance information related to the selected object.
If the selected object is a CPU or a Process, the report shows the disk processes running in that
CPU and a detailed listing of related performance statistics. If the selected object is not a CPU or
a Process, the report covers all disks on the specified system.
Show Related Files
Select Show Related Files to display a report of files related to the selected object. When this
report is generated, a query is first posted to your host system, and then the response appears
in a scrollable view of file information related to the selected object. If the selected object is not
a file, the report is for all monitored files on the specified system.
Show Related Processes
Select Show Related Processes to display a report of processes related to the selected object.
When this report is generated, a query is first posted to your host system and the response appears
in a scrollable view of busiest process performance information related to the selected object.
If the selected object is a CPU or a Process, the report shows the busiest processes running in
that object's CPU. If the selected object is not a CPU or a Process, the report is a Busiest Process
report for all CPUs on the specified system.
Show Related Expand Lines
To display a report of Expand lines related to the selected object, select Show Related Expand
Lines. When this report is generated, a query is first posted to your host system and the response
appears in a scrollable view of Expand performance information related to the selected object.
For example, if the selected object is a CPU or a Process, the report contains a report on the
Expand line handlers running in that CPU. If the selected object is not a CPU or a Process, the
report is an Expand Line statistics report for all Expand lines on the specified system.
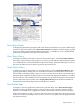
Show Related Measurement
Select Show Related Measurement to configure and display detailed measurement on demand
reports. When you select an object in a grid or graph and select Show Related Measurement, a
Dashboard Measurement control panel is displayed with options. This activity starts and
configures a detailed measurement. Upon completion, it provides a series of in-depth reports
that are automatically displayed in a report window. The Show Related Measurement control
panel options are:
DescriptionOption
Controls the Segment name to be analyzed.Node
Controls the Entity to be analyzed.Entity
Controls the Object to be analyzed. The initial segment, entity, object values
are for the object you initially selected.
Object
Controls the number of busiest components displayed for the selected object.
For example, if you select TopN of 10 and the object is a disk, the ten busiest
files on that disk volume and the ten busiest processes for that disk volume
appear in sorted order from most busy to least busy.
TopN
54 Using the Client Windows