
Neoview Management Dashboard Client Guide for Database Administrators (R2.4)


Show Object Details
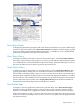
To display all performance properties and values for the selected object or to open a detail report
window for the selected object, select Show Object Details. The Report window displays a graph
of the user-defined graph attributes. Below the graph is a scrollable list view of all Dashboard
performance properties for that object and their values.
Show Object History
To display a detailed recent history report for the selected object, select Show Object History.
This report is generated by posting a query to your host system and then displaying the response
in a scrollable history view of information for the selected object. When the entity type is a Process,
the report is a Busiest Process History report for the selected CPU.
Graph Object History
To display a graph of recent history for the selected object, select Graph Object History. This
graph is generated by making the view in the Browse window match the object name of the
selected object, and then posting a query to your host system for more history about that object.
When the query completes, the query response is automatically displayed in that Browse window.
This function lets you extend the history information for any object that appears in the Browse
window. Select the object and then select Graph Object History from the menu. Dashboard
automatically back fills the object history in the Browse window.
Show Related Apps
To display a report of applications related to the selected object, select Show Related Apps.
When this report is generated, a query is first posted to your host system, and the response
appears in a scrollable view of application statistics information related to the selected object.
If the selected object is a CPU or a Process, the report shows the application processes running
in that CPU. If the selected object is not a CPU or a Process, the report covers all applications on
the specified system.
Report Window 53