
Neoview Management Dashboard Client Guide for Database Administrators (R2.4)


OSC Thresholds
Use the Thresholds function to display the Utilization Thresholds control panel.
OSC Properties
Use the Properties function to open the Dashboard Properties window.
OSC Refresh
Use the Refresh function to refresh the scoreboard and log in the OSC window.
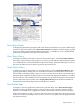
Graph Window
A Graph window provides a compact graphical performance view that is useful for maintaining
multiple status-orientated views of various segment-entity-object combinations. Each Graph
window contains only one graph and can be made small enough to maintain numerous views
at once.
Graph windows update in real time. Many Graph windows can be created from a Browse window
and can be automatically tiled or arranged.
For information about the password-protected Manage menu commands (Kill, Suspend, and
Resume) available from Query entity graph, grid, and sort views, see Chapter 7 (page 105).
Creating a Graph Window
To create a Graph window, do one of:
• In the main Browse window, select View > Graph Nodes.
• In the main Browse window, double-click any column in the grid.
• In the main Browse window, select a range of grid rows, right-click the selected row or rows
to open the menu, and then select New Graph.
Graph Window Status Messages
The Status bar at the base of a Graph window shows the date, time, and number of samples
displayed in the Graph window. Graph windows update in real time, so this information helps
you determine the timeliness of the data in the graph. When multiple samples are displayed in
the Graph window, status messages end with an x N notation, where N indicates the number of
samples.
Graph Window Rotate Control
The Graph window includes a Rotate Graph control to change the rotation and elevation angles
of a graph for optimal viewing.
To use the Rotate Graph control:
1. Click the control, and hold down the mouse button.
2. Drag in the direction you want to rotate the graph:
• Change the rotation of the graph by dragging the mouse to the left or right.
• Change the elevation of a graph by dragging the mouse up or down.
Graph Window 51