
Neoview Management Dashboard Client Guide for Database Administrators (R2.4)

2. Drag in the direction you want to rotate the graph:
• Change the rotation of a graph by dragging the mouse to the left or right.
• Change the elevation of a graph by dragging the mouse up or down.
To permanently save Browse window graph rotation or elevation changes, select the Save Rotate
Angles check box on the Graph property sheet.
Rotate Graph Toolbar Button
To use the Rotate Graph toolbar button:
• Click the Rotate Graph toolbar button to rotate the viewing angle of the Graph in the Browse
window slightly each time it is clicked.
• Click this button repeatedly to show the graph at a variety of angles, retracing prior viewing
angles at the end of each complete rotation.
Sort View Toolbar Button
Use the Sort View toolbar button to obtain sorted views of Dashboard performance information.
In Sort View, you can sort segment, entities, objects, and their property attribute values by clicking
a heading for that attribute column.
Normally Dashboard displays Browse window information in Grid View. You can tell which
mode you are in because the word Grid or Sort always appears in the upper-right corner of the
Browse window grid data area. In Sort View, to obtain sorted reports, click column headings.
In Grid View, right-click to display menus containing context-sensitive reports on selected objects.
To toggle between the Sort and Grid views, click the Sort View toolbar button. You can also
toggle the Sort View on and off by clicking Grid or Sort in the upper-right corner of the Browse
window.
Use Sort View to determine which segments, entities, and objects in the Neoview system network
are the most or least busy. To do so, select Sort View and the All Segments toolbar buttons. You
can display the most or least used segment-entity attributes by clicking attribute column headings.
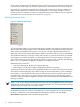
Suppress States Toolbar Button
Use the Suppress States toolbar button to suppress state reporting for selected objects:
• To select a single object, click the row associated with the object in the data grid or graph
portion of the Browse window.
• To select a range of objects, click and drag the range of rows in the data grid. The range is
highlighted.
Once you select the objects for state suppression, click the Suppress States toolbar button. You
can also select View > Suppress States. The State Suppression dialog box appears:
• To add the selected objects to the Suppressed Object State List, click Add.
• To remove the selected objects from the Suppressed Object State List, click Remove.
• To remove all objects from the Suppressed Object State List, click Clear All.
Other Browse Window Toolbar Functions 39