
Neoview Management Dashboard Client Guide for Database Administrators (R2.4)

Status of PC-Host Session
-----
The Browse window has a PC-Host Session Status display that consists of PC and Host icons
connected by a communications link.
The PC icon is a shortcut to the Dashboard Properties window. To open the Dashboard Properties
window so you can change Dashboard properties, click the PC icon.
The Host icon is a shortcut to the Dashboard Session window. To open the Session window so
you can check the status of the Host Session and view the Session log, click the Host icon.
Health Indicators
The PC-Host Status window provides an overall indication of the health of the Client-Server
session. The PC-Host Status window can contain these visual health indicators:
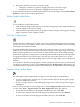
The Host Icon Green with slow blink indicates that the Host Session is up and no errors were
encountered on the last host I/O. To view the Session window and a summary of session status
messages, click the Green icon.
The Host Icon Gray with slow blink indicates that the Host Session has been manually disabled.
To display the Session window and a summary of session status messages, click the Gray icon.
The Host Icon Red X with fast blink indicates that the Dashboard Host Session was activated
but communication to the host server via the Client Server Gateway (CSG) is down. To view the
Session error log, click the Red X icon. After reading the session log, stop and restart the Host
Session via the CSG and then via Dashboard. If this action does not correct the problem, check
the workstation for cabling errors.
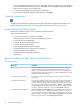
The Host Icon Red ? with fast blink indicates that the last client/server I/O operation had an
error. To view the Session error log, click the Red ? icon. This type of error is typically transient,
and Dashboard usually recovers automatically. Monitor the Session window for a few minutes
to see if Dashboard recovers automatically. If it does not, stop and restart the Host Session.
The communications link between the PC and host shows actual data movement when the Client
is communicating with the Dashboard Server. An explanation of the Client health indicators
appears when you click the Communications Link icon between the PC and Host icons.
Browsing and Analyzing Segments, Entities, and Objects 35