
Neoview Management Dashboard Client Guide for Database Administrators (R2.4)

stop the Host Session using the Session window's menus and toolbar. For more information, see
“Session Window” (page 55).
Real-time Data Management
To minimize the amount of host I/O required for standard real-time displays, Dashboard maintains
a real-time hierarchical cache of statistics. This data cache improves performance and provides
fast response times for specific interactive queries. You can modify the amount of data retained
in cache for each type of object being monitored, as described in “Max Rows/Object Field”
(page 82).
OEM and OIL Views
You can use the Open Enterprise Management Gateway (OEM) or Object Integration Layer (OIL)
to obtain high-level views of segments, entities, and objects. Select an object in the OEM or OIL
to generate a Dashboard report on that object. Statistics and state information can also be
automatically propagated upward through the OIL tree view on a priority basis. The algorithm
ensures that even when you collapse the OIL tree view, the relative utilization and state of
segments, entities, or objects are visible. For more information, see “OEM Property Sheet”
(page 69)and “OIL Property Sheet” (page 71).
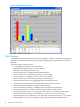
OSC View
You can use the Object State Change (OSC) view to obtain a history of object state changes. The
OSC view provides both a high-level graphical overview and a detailed log of object state changes.
The OSC scoreboard displays an annotated matrix summarizing the number and type of state
changes that have occurred. The scoreboard contains a row for each entity type monitored and
a column for each state monitored. When you select a cell in the scoreboard, the OSC log is
searched for all Object State Changes that match the selected entity type and state. For example,
if you click a cell that intersects the Disk row, the Down column automatically locates all Down
Disk state changes that have occurred. For more information, see “Object State Changes (OSC)
Window” (page 45).
Notifications
You can use the Notify control panel to configure automatic alerts and report notifications.
Dashboard alerts and report notifications can be sent via phone, pager, e-mail, or Internet browser.
Notifications can be sent when objects change state or can be scheduled to occur at various times
of the day, or they can occur at the end of each analysis sample for inclusion in web site content.
Notification reports can include high-level object state summaries, object state change alerts, or
lists of critical sorted object state information. Reports can be formatted either in color-coded
HTML format or in short text format for use with short text message devices such as wireless
phones or pagers. For more information, see “Notify Control Panel” (page 76).
Icon Server
You can customize icons and colors that appear in the Dashboard environment and in the OEM
and OIL views to allow for internationalization. Use the Icons button on the General tab of the
Dashboard Properties window. For more information on the Icon Server, see “Icon Server Control
Panel” (page 69).
20 Introduction to Dashboard