
Neoview Management Dashboard Client Guide for Database Administrators (R2.4)

• Dashboards, which can be named, saved, and displayed to provide unique sets of
user-defined graphic views
• Automated alerts and detailed notification reports that can be sent via wireless phone, pager,
e-mail, or internet browser
• Reports that can be sent when objects change state and can be scheduled to report at various
times of the day or stored for use in web content at the end of each analysis sample
• Reports that can be obtained by selecting a busy object such as a disk and then selecting
Show Related Measurement to obtain highly detailed reports on the busiest files and process
openers for a selected CPU, Disk, File, or Process
• Command and Control feature, which allows authorized users to kill Neoview SQL queries
running on a Neoview platform.
Client GUI Components
The Dashboard Client GUI consists of several components.
NOTE: This manual uses the word “node” in two different ways, for consistency with the Client
GUI itself:
• In most cases, the term “node” refers to a Neoview processing node. There are 16 processing
nodes in a Neoview segment; you use the Dashboard CPU entity to monitor their status and
activity.
• In a few cases, for instance in relation to the Graph Node option, the term “node” refers to
a Neoview platform segment. In such contexts, this manual usually qualifies the word “node”
with the parenthesized word “(segment).”
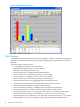
Browse Window
Use the Browse window to view statistics; to browse and analyze segments, Dashboard entities,
and objects; and to control the Dashboard environment. This window updates in real time to
reflect the segments, entities, and objects you select. For more information, see “Browse Window”
(page 27).
Graph Window
You can create one or more Graph windows from a Browse window. Use Graph windows to
maintain multiple views of specific segment-entity-object combinations. These windows update
in real time to reflect the segments, entities, and objects you select. For more information, see
“Graph Window” (page 51).
Report Window
You can get detailed reports about a selected segment, entity, or object in Browse or Graph
windows from shortcut menus. Report windows update in real time to reflect customized reports
about the segments, entities, and objects that you select. For more information, see “Report
Window” (page 52).
Dashboard Properties Window
Use the Dashboard Properties window to customize the Dashboard display, including the entities
to retrieve from the Neoview platform, the attributes of each entity to display, the font to use,
and the options to use for graphing and maintaining the host session. For more information, see
Chapter 5 (page 59).
Session Window
Dashboard can retrieve both real-time and historical statistics information. Through the Session
window, you can view, start, stop, and track the progress of the Host Session. You can start and
Client GUI Components 19