
Neoview Management Dashboard Client Guide for Database Administrators (R2.4)

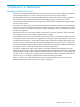

Figure 1-1 Dashboard Entity Screen
Client Features
The Dashboard Client includes a powerful set of graphics, controls, and toolbars that help you
perform ad hoc browsing, reporting, and analysis of application and statistics for a Neoview
platform.
The Client supports these features:
• Compatible with Windows XP workstations
• High-speed hierarchical object cache of statistics
• Real-time state and performance views
• 2-D graphical views of all Dashboard statistical entities
• Browse windows for detailed entity analysis and reporting
• Graph windows for multiple real-time views of host objects
• Report windows for customized reporting of selected objects
• Performance and State icons propagated upward through tree view
• Automatic host communication using the Client Server Gateway (CSG)
• Shortcut menus for all graphs and grids for data mining
• Full customization of displays, including entity and attribute specification
• Encapsulated interface to Open Enterprise Management Gateway (OEM)
• Object State Change (OSC) view, which provides a history of all object state changes
• Internationalization and user-customization of objects, states, icons, and colors
• Object Integration Layer (OIL) tree view, which provides hierarchical access to all objects
• Monitoring the CPU, Disk, ProcessBusy, Query, QueryRTS,Table, and TMF entities
18 Introduction to Dashboard