
Neoview Management Dashboard Client Guide for Database Administrators (R2.4)

1 Introduction to Dashboard
Dashboard Client Overview
The Neoview Management Dashboard provides an infrastructure for monitoring the operational
status and performance of system resources and queries on the Neoview platform.
The Dashboard Client runs on Microsoft Windows XP workstations and provides a graphical
user interface (GUI) to Dashboard statistics and intelligent agent functions. The Client
communicates with Dashboard server components on the Neoview platform through the Client
Server Gateway (CSG).
The Client GUI displays Neoview platform performance and state information and availability
statistics for system and application objects. From the Client, you can view and analyze real-time
or historical views of CPU, Disk, ProcessBusy, Query, QueryRTS, Table, and TMF entities from
all reporting segments.
Informational views can encompass all the segments in a Neoview platform; reflect a selected
set of segments; or focus on a single segment, entity, or object.
The Client provides access to the Command and Control feature, which allows authorized users
to suspend, resume, and kill Neoview SQL queries running on a Neoview platform. You access
Command and Control for a selected query using a shortcut menu from Query entity grid, graph,
and sort views. For information about using Command and Control, see Chapter 7 (page 105).
The Client has built-in agent functions that run on Windows XP. The Client automatically retrieves
and analyzes statistics from the Dashboard on the Neoview platform.
The Client communicates object information to the Open Enterprise Management Gateway
(OEM). State information is also reported, letting enterprise management frameworks supported
by OEM adapters display objects and their operational states. Client services can be configured
to notify you by e-mail, phone, or pager and to forward object statistics and state information to
e-mail servers or to enterprise management frameworks through the OEM.
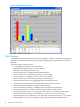
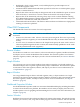
Figure 1-1 shows one of the Dashboard entity screens displayed from the Client. For more
information about the entity screens, see Chapter 6 (page 85).
Dashboard Client Overview 17