
Neoview Workload Management Services Guide (R2.3)
589848 1 2008-04-03 18:18:18.350083 2008-04-03 18:18:18.350125
212075561898350125 212075561898350133
MXID01002010476212075562920218543000000004004DBA100_234_S1
EXECUTING SERVICE2
2.1405113621293412 2.4270026755241196
0.43943207564842224 0.45029863646618223 0.39207400850312774 2.1405113621293412
1.0 \WMS0102.$Z0DN PC-D530||FASTJDBC
DBA1
524312 3 2008-04-03 18:18:15.388603 2008-04-03 18:18:15.388633
212075561895388633 212075563928780174
MXID01003010491212075562925097818000000004004DBA100_234_S1
EXECUTING SERVICE3
2.1405113621293412 2.4270026755241196
0.43943207564842224 0.45029863646618223 0.39207400850312774 2.1405113621293412
1.0 \WMS0103.$Z0FH PC-D530||FASTJDBC
DBA1
589848 1 2008-04-03 18:18:15.981358 2008-04-03 18:18:15.981392
212075561895981392 212075561895981400
--- WMS operation complete.
NS%
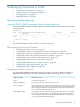
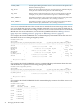
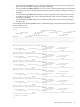
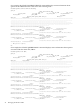
For example, this STATUS QUERY <query-id> command displays status information about a
query identified by the specified query ID:
NS%status query MXID01002010476212075562920218543000000004004DBA100_234_S1;
QUERY_ID
QUERY_STATE SERVICE_NAME
EST_COST EST_CPU_TIME EST_IO_TIME
EST_MSG_TIME EST_IDLE_TIME EST_TOTAL_TIME EST_CARDINALITY
PROCESS_NAME QUERY_NAME
ROLE_NAME
SERVICE_INDEX QUERY_INDEX START_TS ENTRY_TS
ENTRY_JTS LAST_UPDATED
----------------------------------------------------------------------------------------------------------------------------------------------------------------
----------- ------------------------------------------------------------------------------------------------
------------------------ ------------------------ ------------------------ ------------------------
------------------------ ------------------------ ------------------------ --------------------------------
----------------------------------------------------------------------------------------------------------------------------------------------------------------
-------------------------------------------------- ------------- ----------- --------------------------
-------------------------- -------------------- --------------------
MXID01002010476212075562920218543000000004004DBA100_234_S1
EXECUTING SERVICE2
2.1405113621293412 2.4270026755241196
0.43943207564842224 0.45029863646618223 0.39207400850312774 2.1405113621293412
1.0 \WMS0102.$Z0DN PC-D530||FASTJDBC
DBA1
536476 3 2008-04-03 18:18:15.388603 2008-04-03 18:18:15.388633
212075561895388633 212075561927651228
--- WMS operation complete.
NS%
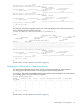
For the syntax, see the “STATUS Command” (page 66).
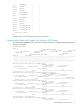
Displaying the Total Number of Executing Queries
Use the STATUS QUERIES EXECUTING STATS command to display the total number of
executing queries in various states on each segment of the Neoview platform.
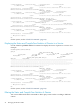
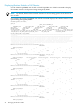
For example, this STATUS QUERIES EXECUTING STATS command displays the total number
of executing queries in various states per segment:
NS%status queries executing stats;
SEGMENT TOT_INITIAL TOT_OPEN TOT_EOF TOT_CLOSE TOT_DEALLOCATED TOT_FETCH TOT_CLOSE_TABLES
TOT_PREPARE
----------- ----------- ----------- ----------- ----------- --------------- ----------- ----------------
-----------
1 2 0 0 0 0 0 0
0
2 2 0 0 0 0 0 0
0
3 2 0 0 0 0 0 0
0
--- WMS operation complete.
NS%
For the syntax, see the “STATUS Command” (page 66).
Monitoring Services and Queries 47