
Neoview Workload Management Services Guide (R2.3)
0.43943207564842224 0.45029863646618223 0.39207400850312774 2.1405113621293412
1.0 \WMS0102.$Z0DR PC-D530||FASTJDBC
DBA1
458776 0 2008-04-03 18:18:09.613894 2008-04-03 18:18:09.613916
212075561889613916 212075561895388641
MXID01003010491212075562925097818000000004004DBA100_234_S1
EXECUTING SERVICE3
2.1405113621293412 2.4270026755241196
0.43943207564842224 0.45029863646618223 0.39207400850312774 2.1405113621293412
1.0 \WMS0103.$Z0FH PC-D530||FASTJDBC
DBA1
589848 1 2008-04-03 18:18:15.981358 2008-04-03 18:18:15.981392
212075561895981392 212075561895981400
MXID01002000687212075563079285896000000012114SUPER.SERVICES00_7802_SQL_CUR_3
COMPLETED HP_DEFAULT_SERVICE
0.017414606623438217 0.10269460796881982
0.11072000134299742 0.09800000134418951 0.09800000134418951 0.017414606623438217
100.0 \WMS0102.$Z0DT CACNARAIN||COAST.exe
SUPER.SERVICES
262168 2 2008-04-03 18:18:13.561928 2008-04-03 18:18:13.561968
212075561893561968 212075561895388641
MXID01002010476212075562920218543000000004004DBA100_234_S1
EXECUTING SERVICE2
2.1405113621293412 2.4270026755241196
0.43943207564842224 0.45029863646618223 0.39207400850312774 2.1405113621293412
1.0 \WMS0102.$Z0DN PC-D530||FASTJDBC
DBA1
524312 3 2008-04-03 18:18:15.388603 2008-04-03 18:18:15.388633
212075561895388633 212075561895388641
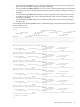
--- WMS operation complete.
NS%
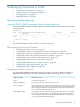
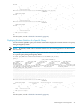
For the syntax, see the “STATUS Command” (page 66).
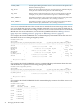
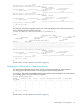
Displaying the Status and Compile-Time Statistics of Queries in a Service
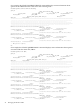
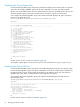
Use the STATUS QUERIES SERVICE command to display the status of queries in a service. For
example:
NS%status queries service service1;
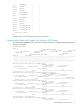
QUERY_ID
QUERY_STATE SERVICE_NAME
EST_COST EST_CPU_TIME EST_IO_TIME
EST_MSG_TIME EST_IDLE_TIME EST_TOTAL_TIME EST_CARDINALITY
PROCESS_NAME QUERY_NAME
ROLE_NAME
SERVICE_INDEX QUERY_INDEX START_TS ENTRY_TS
ENTRY_JTS LAST_UPDATED
----------------------------------------------------------------------------------------------------------------------------------------------------------------
----------- ------------------------------------------------------------------------------------------------
------------------------ ------------------------ ------------------------ ------------------------
------------------------ ------------------------ ------------------------ --------------------------------
----------------------------------------------------------------------------------------------------------------------------------------------------------------
-------------------------------------------------- ------------- ----------- --------------------------
-------------------------- -------------------- --------------------
MXID01002020452212075562925258497000000004204DBA100_244_S1
EXECUTING SERVICE1
2.1405113621293412 2.4270026755241196
0.43943207564842224 0.45029863646618223 0.39207400850312774 2.1405113621293412
1.0 \WMS0102.$Z0DR PC-D530||FASTJDBC
DBA1
458776 0 2008-04-03 18:18:09.613894 2008-04-03 18:18:09.613916
212075561889613916 212075561895388641
MXID01003020448212075562925137594000000004204DBA100_244_S1
EXECUTING SERVICE1
2.1405113621293412 2.4270026755241196
0.43943207564842224 0.45029863646618223 0.39207400850312774 2.1405113621293412
1.0 \WMS0103.$Z0FJ PC-D530||FASTJDBC
DBA1
458776 0 2008-04-03 18:18:11.032345 2008-04-03 18:18:11.032383
212075561891032383 212075561895981400
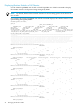
--- WMS operation complete.
NS%
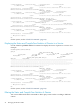
For the syntax, see the “STATUS Command” (page 66).
Filtering the Status and Compile-Time Statistics of Queries
You can use different STATUS commands to filter query status results according to different
criteria:
44 Managing Workload in WMS