
Neoview Workload Management Services Guide (R2.3)

WMS obtains compile-time information about the query from the NDCS server, such as the query
ID, CPU time, I/O time, messages time, idle time, total time, and cardinality. At preconfigured
intervals, WMS also captures system resource information, such as the CPU busy, memory usage,
query cache hits, and disk I/O, and also captures query runtime statistics.
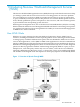
How to Use WMS
Using WMS commands, you can set properties at the system level or at the service level to manage
resource consumption and query workloads. At the system level, WMS monitors queries based
on CPU and memory usage. At the service level, WMS monitors queries based on the thresholds
that you set for the service, such as the priority, CPU busy, memory usage, and active time. For
more information, see:
• “Setting Up Services and Thresholds in WMS” (page 20)
• “Setting System Thresholds in WMS” (page 20)
• “Monitoring and Managing Queries in WMS” (page 20)
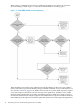
Setting Up Services and Thresholds in WMS
Using WMS commands, you can configure service levels in WMS for queries that run on the
Neoview platform. Each service level has a priority and a set of rules, or threshold limits, which
specify the maximum CPU busy, the maximum memory usage, and the active period of query
execution for the service.
WMS manages queries associated with a service level according to the priority and thresholds
of the service level. If a service level has a low priority, the queries associated with the low-priority
service level are executed later in the queue. If a service level has an active period from 20:00 to
23:00, WMS prevents queries associated with the service from starting to execute outside the
time range by rejecting those queries. If the maximum CPU busy or memory usage is reached
for the service, WMS puts new queries in the waiting queue.
To configure WMS with service levels and thresholds, see Chapter 3 (page 25).
Setting System Thresholds in WMS
You can also configure system thresholds in WMS, such as the maximum CPU busy, the maximum
memory usage, and the interval for collecting query runtime statistics. For more information,
see “Configuring the WMS System Configuration” (page 33).
If the CPU or memory usage exceeds the maximum limit, WMS prevents waiting queries from
being executed to prevent additional CPU or memory from being used and to prevent those
queries from affecting the currently executing queries. New queries are put in the waiting queue.
Monitoring and Managing Queries in WMS
To manage query workloads according to the service levels that you configured in WMS, you
must associate the queries with a service name. There are specific methods and functions that
enable you to associate queries with a service level in JDBC and ODBC client applications. If you
are executing queries in NCI, use the SET SERVICE statement to set the service level of the NCI
session. For more information about associating queries with services, see Chapter 4 (page 35).
You can monitor the queries and services being managed by WMS by using WMS commands
in client applications, such as NCI. The WMS command, STATUS, returns information to the
client application about the queries and services being managed by WMS. The WMS commands,
HOLD, RELEASE, and CANCEL, enable you to hold queries that are in the waiting queue, release
holding queries, and cancel queries to free resources, respectively. For more information about
using WMS commands to monitor and manage query workloads, see Chapter 5 (page 41).
You can also monitor the queries being managed by WMS by using the Neoview Management
Dashboard Client. The QueryRTS entity in the Dashboard Client displays the queries being
managed by WMS in a graphical user interface. The Command and Control feature of the
20 Introducing Neoview Workload Management Services (WMS)