
Neoview Management Dashboard Client Guide for Database Administrators (R2.3)
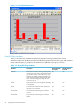
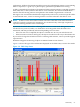
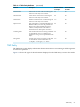
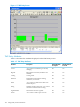
Table Of Contents
- HP Neoview Management Dashboard Client Guide for Database Administrators
- Table of Contents
- About This Document
- 1 Introduction to Dashboard
- 2 Installing the Client
- 3 Starting and Running the Client
- 4 Using the Client Windows
- Browse Window
- Browse Window Toolbar Button Summary
- Browsing and Analyzing Segments, Entities, and Objects
- Other Browse Window Toolbar Functions
- Command Wizard Toolbar Button
- Download Wizard Toolbar Button
- Object State Change Toolbar Button
- OEM Toolbar Button
- OIL Toolbar Button
- Properties Toolbar Button
- Refresh With Latest Data Button
- Rotate Graph Control
- Rotate Graph Toolbar Button
- Sort View Toolbar Button
- Suppress States Toolbar Button
- Thresholds Toolbar Button
- Browse Window Pull-Down Menus
- Browse Window File, Edit, View, and Help Menus
- Browse Window Shortcut Menus
- Object State Changes (OSC) Window
- Graph Window
- Report Window
- Session Window
- 5 Using the Client Property Sheets
- Attribute Property Sheet
- Font Property Sheet
- General Property Sheet
- Annotate Grid With States Check Box
- Clear Registry Button
- Command Wizard Check Box
- Data Query Tool Bar Enable Check Box
- Icons Button
- New Graph on Data Grid Double Click Check Box
- Reports Auto Refresh Check Box
- Set Password Button
- Show Help in Grid Check Box
- Show Splash Screen Check Box
- Show Removed Objects Check Box
- Stretch/Compress Grid Columns to Fit Window Check Box
- Graph Property Sheet
- Icon Server Control Panel
- OEM Property Sheet
- OIL Property Sheet
- OSC Property Sheet
- Monitor Object State Changes Check Box
- Display Log Window Check Box
- State Upgrades Monitored Check Box
- Notify Button
- State Downgrades Monitored Check Box
- Minimum State Change Monitored List
- Maximum Change History Retained in Log List
- Late Data Integrity Check List
- Audible Alert State Threshold List
- Notify Control Panel
- SSG Property Sheet
- Client Server Gateway Check Box
- Retrieval Options
- Sample Delay Options
- Trace Requests Check Box
- Trace Replies Check Box
- Trace Audits Check Box
- Show CSG Until Connected Check Box
- Auto Connect to CSG at Startup Check Box
- Auto Restart Session Check Box
- Max Rows/Object Field
- SSG/CSG Advanced Button
- SSG/CSG Advanced Control Panel
- Exit Shutdown Check Box
- Data Cache Check Box
- SSG Cache Field
- Enable Flow Control Option
- Disable Flow Control Option
- Accept Server Initiated Flow Control Option
- Term Name Check Box
- User Name Field
- Defaults Button
- 6 Using Entity Screen Information
- 7 Using Command and Control to Manage Queries
- 8 Switching Between Neoview Platforms
- Index
performance. It follows that monitoring tables proactively, and updating statistics or reorganizing
tables as required, is a good way to prevent query performance problems from arising.
A table or materialized view begins to be monitored when a missing statistics event (SQL warnings
6007, 6008, 6010, or 6011) refers to that table or view. Thereafter, it is monitored until fifteen
minutes after the missing statistics are updated or the needed reorganization is achieved.
HP support can customize the Dashboard configuration (on the server) to monitor specific tables
or materialized views, even if no missing statistics event has referred to the table or view.
NOTE: A table or view whose name contains characters other than 7–bit ASCII characters
cannot be explicitly configured for monitoring. It is monitored only of the SQL compiler has
reported a missing statistics event concerning it.
By default, the refresh interval for collecting table statistics is 60 seconds. Reorg status is not
checked at every interval; rather, it is checked for an existing table when the table is first
monitored, and then periodically afterward depending on its last state:
• If the last state was Completed, the object is checked once in every 60 refresh intervals.
• If the last state was None or In Progress, the object is checked once in every 5 refresh intervals.
If you wish to change the refresh intervals for collecting table statistics, contact your HP Support
representative.
Dashboard supports monitoring of objects in 2000 and 2300 version schemas.
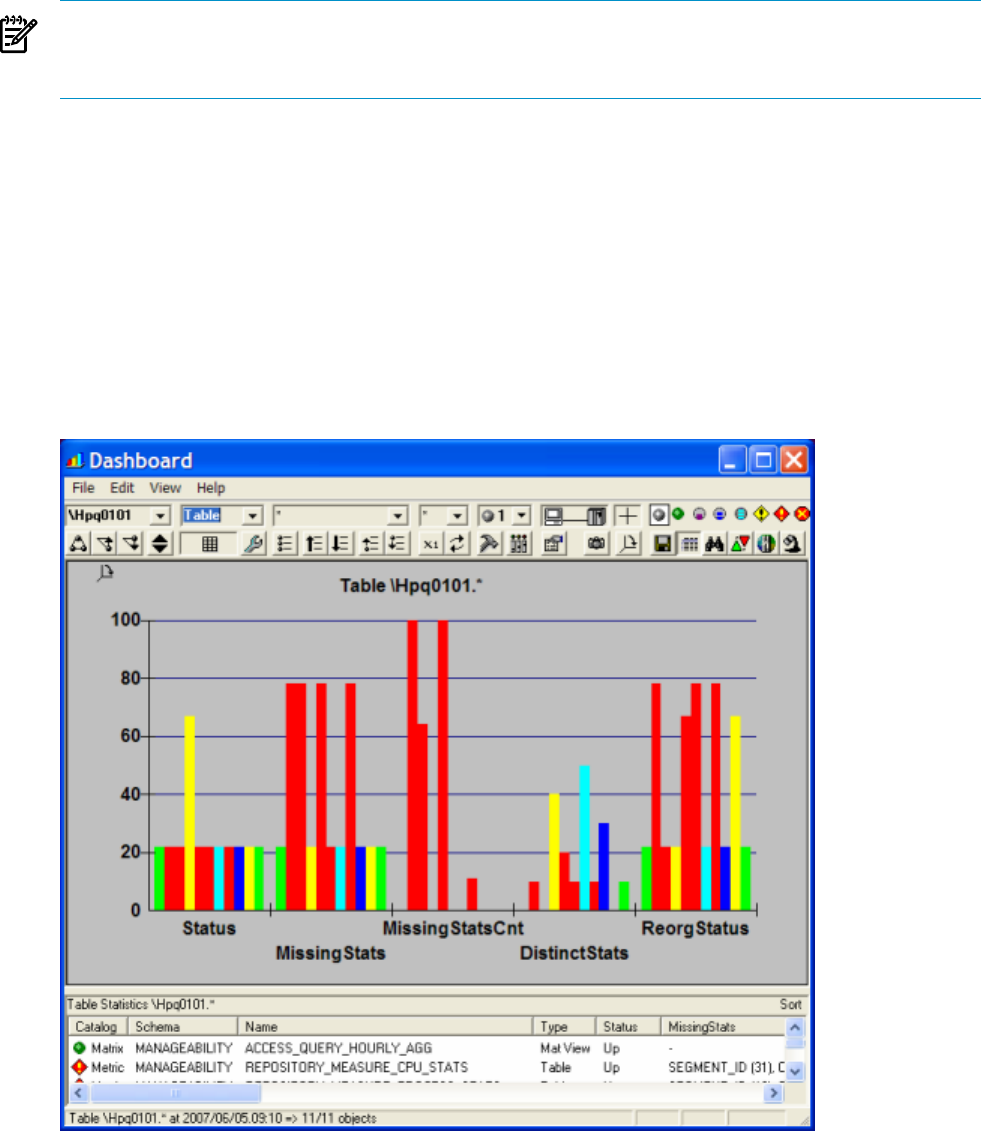
Figure 6-6 shows the types of the information displayed on the Table entity screen in Sort mode.
Figure 6-6 Table Entity Screen
Table Entity 97