
Neoview Management Dashboard Client Guide for Database Administrators (R2.3)
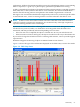
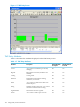
Table Of Contents
- HP Neoview Management Dashboard Client Guide for Database Administrators
- Table of Contents
- About This Document
- 1 Introduction to Dashboard
- 2 Installing the Client
- 3 Starting and Running the Client
- 4 Using the Client Windows
- Browse Window
- Browse Window Toolbar Button Summary
- Browsing and Analyzing Segments, Entities, and Objects
- Other Browse Window Toolbar Functions
- Command Wizard Toolbar Button
- Download Wizard Toolbar Button
- Object State Change Toolbar Button
- OEM Toolbar Button
- OIL Toolbar Button
- Properties Toolbar Button
- Refresh With Latest Data Button
- Rotate Graph Control
- Rotate Graph Toolbar Button
- Sort View Toolbar Button
- Suppress States Toolbar Button
- Thresholds Toolbar Button
- Browse Window Pull-Down Menus
- Browse Window File, Edit, View, and Help Menus
- Browse Window Shortcut Menus
- Object State Changes (OSC) Window
- Graph Window
- Report Window
- Session Window
- 5 Using the Client Property Sheets
- Attribute Property Sheet
- Font Property Sheet
- General Property Sheet
- Annotate Grid With States Check Box
- Clear Registry Button
- Command Wizard Check Box
- Data Query Tool Bar Enable Check Box
- Icons Button
- New Graph on Data Grid Double Click Check Box
- Reports Auto Refresh Check Box
- Set Password Button
- Show Help in Grid Check Box
- Show Splash Screen Check Box
- Show Removed Objects Check Box
- Stretch/Compress Grid Columns to Fit Window Check Box
- Graph Property Sheet
- Icon Server Control Panel
- OEM Property Sheet
- OIL Property Sheet
- OSC Property Sheet
- Monitor Object State Changes Check Box
- Display Log Window Check Box
- State Upgrades Monitored Check Box
- Notify Button
- State Downgrades Monitored Check Box
- Minimum State Change Monitored List
- Maximum Change History Retained in Log List
- Late Data Integrity Check List
- Audible Alert State Threshold List
- Notify Control Panel
- SSG Property Sheet
- Client Server Gateway Check Box
- Retrieval Options
- Sample Delay Options
- Trace Requests Check Box
- Trace Replies Check Box
- Trace Audits Check Box
- Show CSG Until Connected Check Box
- Auto Connect to CSG at Startup Check Box
- Auto Restart Session Check Box
- Max Rows/Object Field
- SSG/CSG Advanced Button
- SSG/CSG Advanced Control Panel
- Exit Shutdown Check Box
- Data Cache Check Box
- SSG Cache Field
- Enable Flow Control Option
- Disable Flow Control Option
- Accept Server Initiated Flow Control Option
- Term Name Check Box
- User Name Field
- Defaults Button
- 6 Using Entity Screen Information
- 7 Using Command and Control to Manage Queries
- 8 Switching Between Neoview Platforms
- Index

Table 6-5 QueryRTS Entity Attributes (continued)
Default Attribute
for Grid?
Default Attribute
for Graph?
DescriptionAttribute
YesNoWarning returned to the stats collector by RTS.StatsErrorCode
YesNoFor Master Executor and ESPs, kilobytes of SQL
space allocated. This type of memory continues
to grow during query processing. (Compare
SQLHeapAlloc.)
SqlSpaceAlloc
YesNoFor Master Executor and ESPs, kilobytes of SQL
space actually used. This type of memory
continues to grow during query processing.
(Compare SQLHeapUsed.)
SqlSpaceUsed
YesNoFor Master Executor and ESPs, kilobytes of SQL
heap allocated. This type of memory fluctuates
during query processing. (Compare
SQLSpaceAlloc.)
SqlHeapAlloc
YesNoFor Master Executor and ESPs, kilobytes of SQL
heap actually used. This type of memory
continues fluctuates during query processing.
(Compare SQLSpaceUsed.)
SqlHeapUsed
YesNoApproximate total processing node(CPU) time,
in microseconds, used by Master Executor and
ESPs for this query.
SqlCpuTime
YesNoFor Executor in disk process, kilobytes of
memory space allocated. This type of memory
continues to grow during query processing.
(Compare EidHeapAlloc.)
EidSpaceAlloc
YesNoFor Executor in disk process, kilobytes of
memory space actually used. This type of
memory continues to grow during query
processing. (Compare EidHeapUsed.)
EidSpaceUsed
YesNoFor Executor in disk process, kilobytes of heap
allocated. This type of memory fluctuates
during query processing. (Compare
EidSpaceAlloc.)
EidHeapAlloc
YesNoFor Executor in disk process, kilobytes of heap
actually used. This type of memory continues
fluctuates during query processing. (Compare
EidSpaceUsed.)
EidHeapUsed
YesNoEstimated number of rows to be accessed for
the query. Estimated at the time the query is
prepared.
EstAccessedRows
YesNoEstimated number of rows to be used by the
query. Estimated at the time the query is
prepared.
EstUsedRows
Table Entity
The Table entity screen displays information about tables or materialized views that have outdated
or missing statistics. The grid in the bottom part of the display includes one row for each table
or materialized view that has outstanding missing statistics. As statistics are updated, the
corresponding tables or materialized views disappear from the display.
Table entity information can be useful when you are trying to understand why a query is
performing badly, because missing or obsolete statistics can cause poor query performance. Table
fragmentation (requiring a REORG on the table) is another possible cause of poor query
96 Using Entity Screen Information