
Neoview Management Dashboard Client Guide for Database Administrators (R2.3)
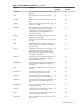
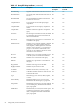
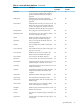
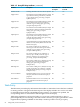
Table Of Contents
- HP Neoview Management Dashboard Client Guide for Database Administrators
- Table of Contents
- About This Document
- 1 Introduction to Dashboard
- 2 Installing the Client
- 3 Starting and Running the Client
- 4 Using the Client Windows
- Browse Window
- Browse Window Toolbar Button Summary
- Browsing and Analyzing Segments, Entities, and Objects
- Other Browse Window Toolbar Functions
- Command Wizard Toolbar Button
- Download Wizard Toolbar Button
- Object State Change Toolbar Button
- OEM Toolbar Button
- OIL Toolbar Button
- Properties Toolbar Button
- Refresh With Latest Data Button
- Rotate Graph Control
- Rotate Graph Toolbar Button
- Sort View Toolbar Button
- Suppress States Toolbar Button
- Thresholds Toolbar Button
- Browse Window Pull-Down Menus
- Browse Window File, Edit, View, and Help Menus
- Browse Window Shortcut Menus
- Object State Changes (OSC) Window
- Graph Window
- Report Window
- Session Window
- 5 Using the Client Property Sheets
- Attribute Property Sheet
- Font Property Sheet
- General Property Sheet
- Annotate Grid With States Check Box
- Clear Registry Button
- Command Wizard Check Box
- Data Query Tool Bar Enable Check Box
- Icons Button
- New Graph on Data Grid Double Click Check Box
- Reports Auto Refresh Check Box
- Set Password Button
- Show Help in Grid Check Box
- Show Splash Screen Check Box
- Show Removed Objects Check Box
- Stretch/Compress Grid Columns to Fit Window Check Box
- Graph Property Sheet
- Icon Server Control Panel
- OEM Property Sheet
- OIL Property Sheet
- OSC Property Sheet
- Monitor Object State Changes Check Box
- Display Log Window Check Box
- State Upgrades Monitored Check Box
- Notify Button
- State Downgrades Monitored Check Box
- Minimum State Change Monitored List
- Maximum Change History Retained in Log List
- Late Data Integrity Check List
- Audible Alert State Threshold List
- Notify Control Panel
- SSG Property Sheet
- Client Server Gateway Check Box
- Retrieval Options
- Sample Delay Options
- Trace Requests Check Box
- Trace Replies Check Box
- Trace Audits Check Box
- Show CSG Until Connected Check Box
- Auto Connect to CSG at Startup Check Box
- Auto Restart Session Check Box
- Max Rows/Object Field
- SSG/CSG Advanced Button
- SSG/CSG Advanced Control Panel
- Exit Shutdown Check Box
- Data Cache Check Box
- SSG Cache Field
- Enable Flow Control Option
- Disable Flow Control Option
- Accept Server Initiated Flow Control Option
- Term Name Check Box
- User Name Field
- Defaults Button
- 6 Using Entity Screen Information
- 7 Using Command and Control to Manage Queries
- 8 Switching Between Neoview Platforms
- Index

Table 6-5 QueryRTS Entity Attributes (continued)
Default Attribute
for Grid?
Default Attribute
for Graph?
DescriptionAttribute
YesNoNeoview user name of the user who started
the query
Username
YesNoRole of the Neoview user who started the
query.
Role
YesNoName of the device from which the query was
sent.
ClientID
YesNoName of the connectivity driver used to send
the query, e.g., ODBC.
ApplID
YesYesElapsed time in minutes, the sum of queue
time, compile time, and execution time. This
number indicates the total elapsed time for a
completed query and the elapsed time so far
for a query in progress.
Walltime
YesNoIf Dashboard is behind in retrieving data from
WMS, delay time in minutes.
Lagtime
YesNoStarting priority of the Master Executor's child
processes.
Spri
YesNoMinimum priority at which Master Executor's
child processes have run. This value is updated
as the query runs.
Mpri
YesNoEstimated cost of the query, in seconds. This is
the estimated cost of SQL operations in the
Master Executor; it does not include compile
time or queue time. The estimate occurs at the
time the query is prepared.
EstCost
YesYesCumulative processor utilization for the Master
Executor and all its child processes. This value
is updated as the query runs.
TotBusy%
YesNoProcessor utilization percentage for the Master
Executor and all its child processes during the
last interval.
TotalBusyInt%
YesNoTotal number of child processes of the Master
Executor.
ESPs
YesNoTotal number of Master Executor child
processes busy during the last interval.
ESPsBusyInt
YesNoTotal number of Master Executor child
processes currently in the suspended state.
SuspESPs
YesYesCumulative processor utilization for the Master
Executor. This value is updated as the query
runs.
MstrBusy%
YesNoProcessor utilization for the Master Executor
during the last interval.
MstrBusyInt%
YesYesCumulative processor utilization percentage
for all the Executor Server Processes.
TotEsp%
YesNoProcessor utilization for all the Executor Server
Processes during the last interval.
Esp%
YesNoProcessor utilization for the busiest Executor
Server Process.
BusiestESP
QueryRTS Entity 93