
Neoview Management Dashboard Client Guide for Database Administrators (R2.3)
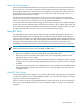
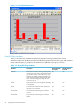
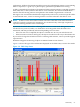
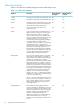
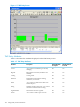
Table Of Contents
- HP Neoview Management Dashboard Client Guide for Database Administrators
- Table of Contents
- About This Document
- 1 Introduction to Dashboard
- 2 Installing the Client
- 3 Starting and Running the Client
- 4 Using the Client Windows
- Browse Window
- Browse Window Toolbar Button Summary
- Browsing and Analyzing Segments, Entities, and Objects
- Other Browse Window Toolbar Functions
- Command Wizard Toolbar Button
- Download Wizard Toolbar Button
- Object State Change Toolbar Button
- OEM Toolbar Button
- OIL Toolbar Button
- Properties Toolbar Button
- Refresh With Latest Data Button
- Rotate Graph Control
- Rotate Graph Toolbar Button
- Sort View Toolbar Button
- Suppress States Toolbar Button
- Thresholds Toolbar Button
- Browse Window Pull-Down Menus
- Browse Window File, Edit, View, and Help Menus
- Browse Window Shortcut Menus
- Object State Changes (OSC) Window
- Graph Window
- Report Window
- Session Window
- 5 Using the Client Property Sheets
- Attribute Property Sheet
- Font Property Sheet
- General Property Sheet
- Annotate Grid With States Check Box
- Clear Registry Button
- Command Wizard Check Box
- Data Query Tool Bar Enable Check Box
- Icons Button
- New Graph on Data Grid Double Click Check Box
- Reports Auto Refresh Check Box
- Set Password Button
- Show Help in Grid Check Box
- Show Splash Screen Check Box
- Show Removed Objects Check Box
- Stretch/Compress Grid Columns to Fit Window Check Box
- Graph Property Sheet
- Icon Server Control Panel
- OEM Property Sheet
- OIL Property Sheet
- OSC Property Sheet
- Monitor Object State Changes Check Box
- Display Log Window Check Box
- State Upgrades Monitored Check Box
- Notify Button
- State Downgrades Monitored Check Box
- Minimum State Change Monitored List
- Maximum Change History Retained in Log List
- Late Data Integrity Check List
- Audible Alert State Threshold List
- Notify Control Panel
- SSG Property Sheet
- Client Server Gateway Check Box
- Retrieval Options
- Sample Delay Options
- Trace Requests Check Box
- Trace Replies Check Box
- Trace Audits Check Box
- Show CSG Until Connected Check Box
- Auto Connect to CSG at Startup Check Box
- Auto Restart Session Check Box
- Max Rows/Object Field
- SSG/CSG Advanced Button
- SSG/CSG Advanced Control Panel
- Exit Shutdown Check Box
- Data Cache Check Box
- SSG Cache Field
- Enable Flow Control Option
- Disable Flow Control Option
- Accept Server Initiated Flow Control Option
- Term Name Check Box
- User Name Field
- Defaults Button
- 6 Using Entity Screen Information
- 7 Using Command and Control to Manage Queries
- 8 Switching Between Neoview Platforms
- Index

Query Time Advancement
The Client and Dashboard database key only supports resolution to the whole second. However,
query events can occur in sub-second times. For example, the Start event and End event for a
query might be generated in less than one second. However, the Query SGP cannot write two
records for the same query to the database in less than one second. If it attempts to do so, a
Duplicate Record error (10) is received.
The Query SGP uses time advancement to resolve a series of sub-second events. If the SGP
receives two events for the same query in less than one second, it adds one second to the time
for the second event when it writes that event to the Dashboard database.
As a result of this time advancement strategy, the time field in the Query SGP might actually be
ahead of the real time. When the Query SGP advances time for a query and the query ends, the
SGP cannot remove the internal memory control block for that query until time catches up. After
the query ends, the SGP records the correct start and end times for the query.
QueryRTS Entity
The QueryRTS entity monitors queries and other SQL statements managed by the Neoview
Workload Management Services (WMS). This entity differs from the Query entity defined in
earlier releases of Dashboard, in that information for the QueryRTS entity is gathered at intervals
while the query is running, not only at the beginning and end of the query. In addition, whereas
the Query entity monitors only queries that enter by way of an NDCS connection server
(MXOSRVR), the QueryRTS entity can monitor queries from other Master Executor processes.
NOTE: The term Master Executor Process, in descriptions of QueryRTS attributes, refers to an
NDCS connection server in the case of an ODBC or JDBC query.
Certain information reported for the Query entity is not reported for the QueryRTS entity:
• SQL text is available for the Query entity but not the QueryRTS entity.
• Data source name is reported for the Query entity. The corresponding attribute for the
QueryRTS entity is Service Name.
• Queries estimated to run for less than one minute and queries estimated to operate on only
a single row are not reflected in QueryRTS displays, because those queries are not managed
by WMS.
• In certain cases, final statistics for a completed query are not available, because WMS cleared
during the Dashboard update interval. In such cases, the QueryRTS entity shows the last
available statistics.
QueryRTS Entity Screen
The QueryRTS entity screen displays a very rich set of information about queries on all segments
in a Neoview platform. As for other Dashboard entities, you can restrict the display to a single
segment, as shown in the example below.
Figure 6-5 shows an image of the QueryRTS entity screen in Sort mode. If you were looking at
this screen in the Dashboard client, you could scroll horizontally to see many more attributes
displayed.
QueryRTS Entity 91