
Neoview Management Dashboard Client Guide for Database Administrators (R2.3)
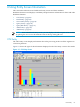
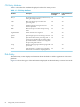
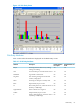
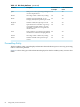
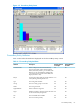
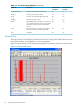
Table Of Contents
- HP Neoview Management Dashboard Client Guide for Database Administrators
- Table of Contents
- About This Document
- 1 Introduction to Dashboard
- 2 Installing the Client
- 3 Starting and Running the Client
- 4 Using the Client Windows
- Browse Window
- Browse Window Toolbar Button Summary
- Browsing and Analyzing Segments, Entities, and Objects
- Other Browse Window Toolbar Functions
- Command Wizard Toolbar Button
- Download Wizard Toolbar Button
- Object State Change Toolbar Button
- OEM Toolbar Button
- OIL Toolbar Button
- Properties Toolbar Button
- Refresh With Latest Data Button
- Rotate Graph Control
- Rotate Graph Toolbar Button
- Sort View Toolbar Button
- Suppress States Toolbar Button
- Thresholds Toolbar Button
- Browse Window Pull-Down Menus
- Browse Window File, Edit, View, and Help Menus
- Browse Window Shortcut Menus
- Object State Changes (OSC) Window
- Graph Window
- Report Window
- Session Window
- 5 Using the Client Property Sheets
- Attribute Property Sheet
- Font Property Sheet
- General Property Sheet
- Annotate Grid With States Check Box
- Clear Registry Button
- Command Wizard Check Box
- Data Query Tool Bar Enable Check Box
- Icons Button
- New Graph on Data Grid Double Click Check Box
- Reports Auto Refresh Check Box
- Set Password Button
- Show Help in Grid Check Box
- Show Splash Screen Check Box
- Show Removed Objects Check Box
- Stretch/Compress Grid Columns to Fit Window Check Box
- Graph Property Sheet
- Icon Server Control Panel
- OEM Property Sheet
- OIL Property Sheet
- OSC Property Sheet
- Monitor Object State Changes Check Box
- Display Log Window Check Box
- State Upgrades Monitored Check Box
- Notify Button
- State Downgrades Monitored Check Box
- Minimum State Change Monitored List
- Maximum Change History Retained in Log List
- Late Data Integrity Check List
- Audible Alert State Threshold List
- Notify Control Panel
- SSG Property Sheet
- Client Server Gateway Check Box
- Retrieval Options
- Sample Delay Options
- Trace Requests Check Box
- Trace Replies Check Box
- Trace Audits Check Box
- Show CSG Until Connected Check Box
- Auto Connect to CSG at Startup Check Box
- Auto Restart Session Check Box
- Max Rows/Object Field
- SSG/CSG Advanced Button
- SSG/CSG Advanced Control Panel
- Exit Shutdown Check Box
- Data Cache Check Box
- SSG Cache Field
- Enable Flow Control Option
- Disable Flow Control Option
- Accept Server Initiated Flow Control Option
- Term Name Check Box
- User Name Field
- Defaults Button
- 6 Using Entity Screen Information
- 7 Using Command and Control to Manage Queries
- 8 Switching Between Neoview Platforms
- Index
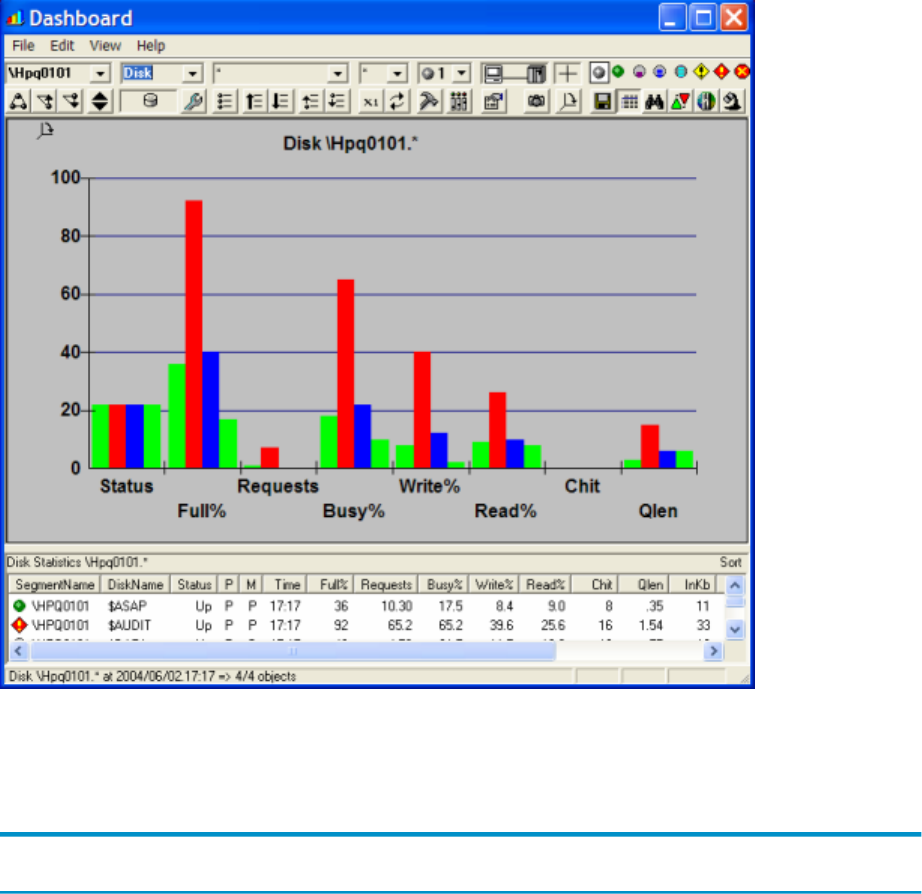
Figure 6-2 Disk Entity Screen
Disk Entity Attributes
Table 6-2 describes the attributes displayed on the Disk entity screen.
Table 6-2 Disk Entity Attributes
Default Attribute for
Grid?
Default Attribute
for Graph?
DescriptionAttribute
YesYesPercentage of time a disk is busy reading,
writing, and seeking.
Busy%
YesYesTotal cache hits per second for all block sizes.Chit
YesNoLogical disk volume name.DiskName
YesNoSize of the largest fragment on the disk
volume, in megabytes.
Fragment
YesYesPercentage of disk space currently used.Full%
YesNoInput in kilobytes per second.InKb
YesNoMirror disk path in use, where the value is P
(Primary) or B (Backup).
M
YesNoName of the Neoview segment.SegmentName
YesNoOutput in kilobytes per second.OutKb
YesNoPrimary disk path in use, where the value is
P (Primary) or B (Backup).
P
Disk Entity 85