
Neoview Management Dashboard Client Guide for Database Administrators (R2.3)
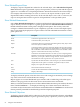
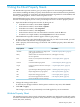
Table Of Contents
- HP Neoview Management Dashboard Client Guide for Database Administrators
- Table of Contents
- About This Document
- 1 Introduction to Dashboard
- 2 Installing the Client
- 3 Starting and Running the Client
- 4 Using the Client Windows
- Browse Window
- Browse Window Toolbar Button Summary
- Browsing and Analyzing Segments, Entities, and Objects
- Other Browse Window Toolbar Functions
- Command Wizard Toolbar Button
- Download Wizard Toolbar Button
- Object State Change Toolbar Button
- OEM Toolbar Button
- OIL Toolbar Button
- Properties Toolbar Button
- Refresh With Latest Data Button
- Rotate Graph Control
- Rotate Graph Toolbar Button
- Sort View Toolbar Button
- Suppress States Toolbar Button
- Thresholds Toolbar Button
- Browse Window Pull-Down Menus
- Browse Window File, Edit, View, and Help Menus
- Browse Window Shortcut Menus
- Object State Changes (OSC) Window
- Graph Window
- Report Window
- Session Window
- 5 Using the Client Property Sheets
- Attribute Property Sheet
- Font Property Sheet
- General Property Sheet
- Annotate Grid With States Check Box
- Clear Registry Button
- Command Wizard Check Box
- Data Query Tool Bar Enable Check Box
- Icons Button
- New Graph on Data Grid Double Click Check Box
- Reports Auto Refresh Check Box
- Set Password Button
- Show Help in Grid Check Box
- Show Splash Screen Check Box
- Show Removed Objects Check Box
- Stretch/Compress Grid Columns to Fit Window Check Box
- Graph Property Sheet
- Icon Server Control Panel
- OEM Property Sheet
- OIL Property Sheet
- OSC Property Sheet
- Monitor Object State Changes Check Box
- Display Log Window Check Box
- State Upgrades Monitored Check Box
- Notify Button
- State Downgrades Monitored Check Box
- Minimum State Change Monitored List
- Maximum Change History Retained in Log List
- Late Data Integrity Check List
- Audible Alert State Threshold List
- Notify Control Panel
- SSG Property Sheet
- Client Server Gateway Check Box
- Retrieval Options
- Sample Delay Options
- Trace Requests Check Box
- Trace Replies Check Box
- Trace Audits Check Box
- Show CSG Until Connected Check Box
- Auto Connect to CSG at Startup Check Box
- Auto Restart Session Check Box
- Max Rows/Object Field
- SSG/CSG Advanced Button
- SSG/CSG Advanced Control Panel
- Exit Shutdown Check Box
- Data Cache Check Box
- SSG Cache Field
- Enable Flow Control Option
- Disable Flow Control Option
- Accept Server Initiated Flow Control Option
- Term Name Check Box
- User Name Field
- Defaults Button
- 6 Using Entity Screen Information
- 7 Using Command and Control to Manage Queries
- 8 Switching Between Neoview Platforms
- Index
State Determination ALL Button
The State Determination ALL button is an advanced feature that selects a range of attributes
from the first attribute that has a state attribute associated with it through the last attribute for
the current entity.
This button lets you quickly select a range of attributes starting with the first attribute that has
a state associated with it, also known as a value,state StatePair. Once you select these attributes
using the ALL button, you can set the State Determination rule for all StatePair attributes all at
once rather than individually.
For example, to set the State Determination rule for all StatePairs to UseStateGraphState, click
the ALL button and then select the State Determination Rule labelled Use State > Graph State.
Conversely, to set the State Determination rule for all StatePairs to UseThresholds, click the ALL
button and then select the State Determination Rule labelled Use Thresholds. The Status attribute
for the entity is not set to UseThresholds. By definition, its state determination rule is
UseStateGraphState.
State Determination Options
DescriptionOptionIcon
The state of an attribute is determined
by the values specified in the
Utilization Thresholds dialog box.
Use Thresholds
Attribute state information is
determined directly by the value of
that attribute.
Use Value Graph Value
Attribute state information is
determined by the state variable
associated with that attribute. The
attribute value is graphed.
Use State Graph Value
Attribute state information is
determined by the state variable
associated with that attribute. The state
value is graphed.
Use State Graph State
Use Thresholds Option
The Use Thresholds option indicates that the state of an attribute is determined by the values
specified in the Utilization Thresholds dialog box. When you set this property for a given attribute,
state determination for the attribute is based entirely on Dashboard utilization thresholds. For
more information, see “Utilization Thresholds Control Panel” (page 70).
When an object's Time attribute has its Show in Graph check box and Use Thresholds options
selected, Dashboard performs a series of automatic time checks to ensure that the time has a
reasonable value. If the time is not reasonable, Dashboard raises the state of the time to an alert
level.
For example, if the time for statistics received from Dashboard is not recent, the Time state for
that object is reported as down, and a Red or Yellow Icon appears next to the time. You should
enable Dashboard time checks because this mechanism helps in the analysis of a variety of
problems, including: server and database errors, down segments, down communication paths,
and incorrect system time settings. To disable Late Data time checks for all entities, select Late
Data Integrity Check > No Check on the OSC Property Sheet.
60 Using the Client Property Sheets