
Neoview Management Dashboard Client Guide for Database Administrators (R2.3)
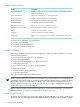
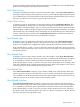
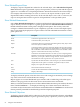
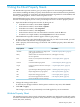
Table Of Contents
- HP Neoview Management Dashboard Client Guide for Database Administrators
- Table of Contents
- About This Document
- 1 Introduction to Dashboard
- 2 Installing the Client
- 3 Starting and Running the Client
- 4 Using the Client Windows
- Browse Window
- Browse Window Toolbar Button Summary
- Browsing and Analyzing Segments, Entities, and Objects
- Other Browse Window Toolbar Functions
- Command Wizard Toolbar Button
- Download Wizard Toolbar Button
- Object State Change Toolbar Button
- OEM Toolbar Button
- OIL Toolbar Button
- Properties Toolbar Button
- Refresh With Latest Data Button
- Rotate Graph Control
- Rotate Graph Toolbar Button
- Sort View Toolbar Button
- Suppress States Toolbar Button
- Thresholds Toolbar Button
- Browse Window Pull-Down Menus
- Browse Window File, Edit, View, and Help Menus
- Browse Window Shortcut Menus
- Object State Changes (OSC) Window
- Graph Window
- Report Window
- Session Window
- 5 Using the Client Property Sheets
- Attribute Property Sheet
- Font Property Sheet
- General Property Sheet
- Annotate Grid With States Check Box
- Clear Registry Button
- Command Wizard Check Box
- Data Query Tool Bar Enable Check Box
- Icons Button
- New Graph on Data Grid Double Click Check Box
- Reports Auto Refresh Check Box
- Set Password Button
- Show Help in Grid Check Box
- Show Splash Screen Check Box
- Show Removed Objects Check Box
- Stretch/Compress Grid Columns to Fit Window Check Box
- Graph Property Sheet
- Icon Server Control Panel
- OEM Property Sheet
- OIL Property Sheet
- OSC Property Sheet
- Monitor Object State Changes Check Box
- Display Log Window Check Box
- State Upgrades Monitored Check Box
- Notify Button
- State Downgrades Monitored Check Box
- Minimum State Change Monitored List
- Maximum Change History Retained in Log List
- Late Data Integrity Check List
- Audible Alert State Threshold List
- Notify Control Panel
- SSG Property Sheet
- Client Server Gateway Check Box
- Retrieval Options
- Sample Delay Options
- Trace Requests Check Box
- Trace Replies Check Box
- Trace Audits Check Box
- Show CSG Until Connected Check Box
- Auto Connect to CSG at Startup Check Box
- Auto Restart Session Check Box
- Max Rows/Object Field
- SSG/CSG Advanced Button
- SSG/CSG Advanced Control Panel
- Exit Shutdown Check Box
- Data Cache Check Box
- SSG Cache Field
- Enable Flow Control Option
- Disable Flow Control Option
- Accept Server Initiated Flow Control Option
- Term Name Check Box
- User Name Field
- Defaults Button
- 6 Using Entity Screen Information
- 7 Using Command and Control to Manage Queries
- 8 Switching Between Neoview Platforms
- Index
Graph-Max Field
When an attribute has its Show in Graph property set, you can specify the Graph-Max
normalization value for that attribute. The Graph-Max field is the unlabeled field immediately
to the right of the Show in Graph check box. This value determines the maximum graph amplitude
or normalization value for the attribute.
For example, if the attribute Queue has a Graph-Max value of 10, and the value of the Queue
attribute is 5, the Queue value appears in the graph at one-half of the maximum graph height.
Graph-Max values are used when the Graph Percent check box is selected on the Graph property
sheet.
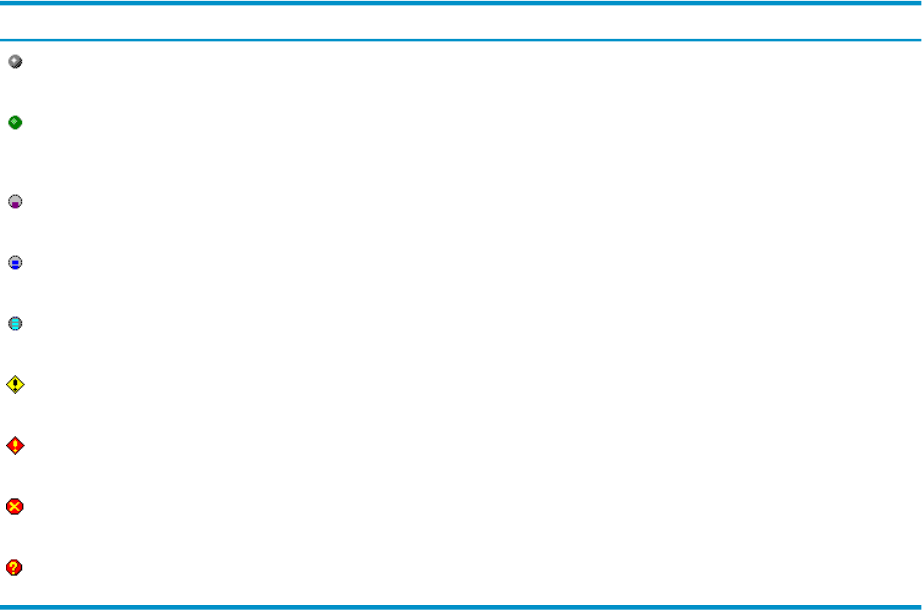
State Determination
You can specify how the state of each attribute is determined when an attribute has its Show in
Graph property set.
In Dashboard, each data attribute has a state associated with it when the attribute has its Show
in Graph property set. Dashboard assigns the state to that attribute based on the State
Determination Option for each attribute. If more than one attribute has its Show in Graph property
enabled for a given object, the attribute with the highest state is said to be the state of the object.
Thus each object can have a state associated with it.
When an object has a state associated with it, the graph for each object is color-coded based on
the state of the object, and the corresponding data value in the grid portion of the Dashboard
Browse window is annotated with the state icon. The Browse window lets you selectively display
objects based on their states. To selectively display objects in the browse window based on their
states, select View > States in the Browse window View menu. This table summarizes Dashboard
states and their associated icons:
DescriptionStateIcon
Object exists.Existence
Object is up or meets the performance
and availability objectives specified for
this Dashboard configuration.
Up or OK
Object utilization is low.Low
Object utilization is medium.Medium
Object utilization is high.High
Object is at Warning level.Warning
Object is at Critical level.Critical
Object is down or not operational.Down
Object state is Questionable.Questionable
To customize object and state icons, use the Icon Server Control Panel. For more information,
see “Icons Button” (page 63)
Attribute Property Sheet 59