
Neoview Management Dashboard Client Guide for Database Administrators (R2.3)
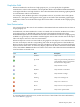
Table Of Contents
- HP Neoview Management Dashboard Client Guide for Database Administrators
- Table of Contents
- About This Document
- 1 Introduction to Dashboard
- 2 Installing the Client
- 3 Starting and Running the Client
- 4 Using the Client Windows
- Browse Window
- Browse Window Toolbar Button Summary
- Browsing and Analyzing Segments, Entities, and Objects
- Other Browse Window Toolbar Functions
- Command Wizard Toolbar Button
- Download Wizard Toolbar Button
- Object State Change Toolbar Button
- OEM Toolbar Button
- OIL Toolbar Button
- Properties Toolbar Button
- Refresh With Latest Data Button
- Rotate Graph Control
- Rotate Graph Toolbar Button
- Sort View Toolbar Button
- Suppress States Toolbar Button
- Thresholds Toolbar Button
- Browse Window Pull-Down Menus
- Browse Window File, Edit, View, and Help Menus
- Browse Window Shortcut Menus
- Object State Changes (OSC) Window
- Graph Window
- Report Window
- Session Window
- 5 Using the Client Property Sheets
- Attribute Property Sheet
- Font Property Sheet
- General Property Sheet
- Annotate Grid With States Check Box
- Clear Registry Button
- Command Wizard Check Box
- Data Query Tool Bar Enable Check Box
- Icons Button
- New Graph on Data Grid Double Click Check Box
- Reports Auto Refresh Check Box
- Set Password Button
- Show Help in Grid Check Box
- Show Splash Screen Check Box
- Show Removed Objects Check Box
- Stretch/Compress Grid Columns to Fit Window Check Box
- Graph Property Sheet
- Icon Server Control Panel
- OEM Property Sheet
- OIL Property Sheet
- OSC Property Sheet
- Monitor Object State Changes Check Box
- Display Log Window Check Box
- State Upgrades Monitored Check Box
- Notify Button
- State Downgrades Monitored Check Box
- Minimum State Change Monitored List
- Maximum Change History Retained in Log List
- Late Data Integrity Check List
- Audible Alert State Threshold List
- Notify Control Panel
- SSG Property Sheet
- Client Server Gateway Check Box
- Retrieval Options
- Sample Delay Options
- Trace Requests Check Box
- Trace Replies Check Box
- Trace Audits Check Box
- Show CSG Until Connected Check Box
- Auto Connect to CSG at Startup Check Box
- Auto Restart Session Check Box
- Max Rows/Object Field
- SSG/CSG Advanced Button
- SSG/CSG Advanced Control Panel
- Exit Shutdown Check Box
- Data Cache Check Box
- SSG Cache Field
- Enable Flow Control Option
- Disable Flow Control Option
- Accept Server Initiated Flow Control Option
- Term Name Check Box
- User Name Field
- Defaults Button
- 6 Using Entity Screen Information
- 7 Using Command and Control to Manage Queries
- 8 Switching Between Neoview Platforms
- Index

the response appears in a scrollable view of Application domain objectives related to the selected
object.
Session Window
Dashboard obtains object status and performance information via an active Host session to a
Neoview platform. Using the Session window, you can view, start, stop, and track the progress
of your Host Session. You can also synchronize the time and date between your workstation and
the server.
To open the Session window, select View > Session in the Browse window or click the Host icon
in the PC-Host Session Status display.
Session Log
You can view the progress of your Dashboard Host Session from the Session window. All Host
Session establishment and I/O activities appear in the log area of the Session window.
The Session log is useful for checking the status of your Host Session. If you are having difficulty
with your Host Session, view the Session log to determine the cause. The log always contains
the latest information about your host dialog, including version information about the CSG, SSG,
and SeeView products.
To save the Session log to disk, select File Save from the Session window.
Session Window Pull-Down Menus
File Menu Items
DescriptionMenu Item
Starts your Host Session and enables the state of the Client Server Gateway
check box on the SSG property sheet.
Start Session
Stops your Host Session and disables the state of the Client Server Gateway
check box on the SSG property sheet.
Stop Session
Saves the current Session log to disk. Select Save Log As to specify the name
of the log file before saving the disk file.
Save Log and Save Log As
Closes the Session window. This option does not stop your Host Session.Close
View Menu Items
DescriptionMenu Item
Displays host I/O statistics for your session. These statistics are used primarily
for diagnostic purposes.
Statistics
Clears the contents of the Session log. This option is used primarily for
diagnostic purposes.
Clear Log
Displays version information for the CSGDLL, CSG, SSG, and SeeView
products. This option is used primarily for diagnostic purposes.
Version Info
Opens a Browse window.Data Window
Displays the Time Sync window. Only HP support personnel can access and
use this window.
Time Sync
Opens the Dashboard Properties window, where you can customize your
environment by specifying which entities and performance attributes the
Browse and Graph windows display.
Options
Session Window 55