
Neoview Management Dashboard Client Guide for Database Administrators (R2.3)
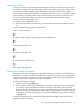
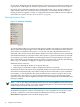
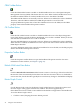
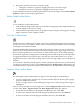
Table Of Contents
- HP Neoview Management Dashboard Client Guide for Database Administrators
- Table of Contents
- About This Document
- 1 Introduction to Dashboard
- 2 Installing the Client
- 3 Starting and Running the Client
- 4 Using the Client Windows
- Browse Window
- Browse Window Toolbar Button Summary
- Browsing and Analyzing Segments, Entities, and Objects
- Other Browse Window Toolbar Functions
- Command Wizard Toolbar Button
- Download Wizard Toolbar Button
- Object State Change Toolbar Button
- OEM Toolbar Button
- OIL Toolbar Button
- Properties Toolbar Button
- Refresh With Latest Data Button
- Rotate Graph Control
- Rotate Graph Toolbar Button
- Sort View Toolbar Button
- Suppress States Toolbar Button
- Thresholds Toolbar Button
- Browse Window Pull-Down Menus
- Browse Window File, Edit, View, and Help Menus
- Browse Window Shortcut Menus
- Object State Changes (OSC) Window
- Graph Window
- Report Window
- Session Window
- 5 Using the Client Property Sheets
- Attribute Property Sheet
- Font Property Sheet
- General Property Sheet
- Annotate Grid With States Check Box
- Clear Registry Button
- Command Wizard Check Box
- Data Query Tool Bar Enable Check Box
- Icons Button
- New Graph on Data Grid Double Click Check Box
- Reports Auto Refresh Check Box
- Set Password Button
- Show Help in Grid Check Box
- Show Splash Screen Check Box
- Show Removed Objects Check Box
- Stretch/Compress Grid Columns to Fit Window Check Box
- Graph Property Sheet
- Icon Server Control Panel
- OEM Property Sheet
- OIL Property Sheet
- OSC Property Sheet
- Monitor Object State Changes Check Box
- Display Log Window Check Box
- State Upgrades Monitored Check Box
- Notify Button
- State Downgrades Monitored Check Box
- Minimum State Change Monitored List
- Maximum Change History Retained in Log List
- Late Data Integrity Check List
- Audible Alert State Threshold List
- Notify Control Panel
- SSG Property Sheet
- Client Server Gateway Check Box
- Retrieval Options
- Sample Delay Options
- Trace Requests Check Box
- Trace Replies Check Box
- Trace Audits Check Box
- Show CSG Until Connected Check Box
- Auto Connect to CSG at Startup Check Box
- Auto Restart Session Check Box
- Max Rows/Object Field
- SSG/CSG Advanced Button
- SSG/CSG Advanced Control Panel
- Exit Shutdown Check Box
- Data Cache Check Box
- SSG Cache Field
- Enable Flow Control Option
- Disable Flow Control Option
- Accept Server Initiated Flow Control Option
- Term Name Check Box
- User Name Field
- Defaults Button
- 6 Using Entity Screen Information
- 7 Using Command and Control to Manage Queries
- 8 Switching Between Neoview Platforms
- Index
Do not select All Segments from the Segment list (*) when viewing more than one sample. Such
a specification could require the analysis of performance information for thousands of objects.
In general, slow workstation responsiveness might indicate that you are trying to display too
many samples. When the workstation does not respond in a reasonable amount of time, try
looking at data one segment at a time or creating individual Graph windows for each segment,
as described in “Browse Window Shortcut Menus” (page 44).
Selecting Minimum State
Figure 4-1 Minimum State Menu
To control whether objects of a particular state appear in the Browse window, use either the State
Filter Toolbar near the upper right corner of the Browse Window or the Minimum State pull-down
menu shown in expanded form in Figure 4-1. The state selected is the Minimum State to be
displayed, and it controls which objects appear the Browse window. When you select a minimum
state, Dashboard displays only objects with a state equal to or greater than the state you selected.
For example, if you select minimum state Warning, the Browse window displays only objects
with a state equal to or greater than Warning. In this case, objects with a state less than Warning
(Exists, Up, Low, Medium, or High) do not appear in the Browse window.
Minimum State is useful for:
• Selectively limiting the display to exception data only
• Reducing the total number of objects displayed in the Browse window
To remind you that not all objects can be displayed, the Browse window status bar (at the bottom
of the Browse window) displays the number of objects shown and found as a pair of numbers.
For example, => 3/16 displayed in the status bar indicates that whereas 16 objects were found,
only three had a state equal to or greater than the minimum state you selected. This display
reminds you that more objects might be found than are actually displayed when Minimum State
filtering is enabled.
NOTE: You can also display the Minimum State menu by selecting States from the View menu
in the Browse window. Finally, you can use the Minimum State as a tear-off menu that you keep
visible and place it where you want on the screen.
Dashboard determines the state of objects on the basis of control settings in the Attribute Tab of
the Dashboard Properties window. An attribute has a state assigned to it if its Show in Graph
property is enabled. To control how Dashboard determines the state, select the State
Determination algorithm on the Attribute Property Sheet.
34 Using the Client Windows