
Neoview Management Dashboard Client Guide for Database Administrators (R2.3)
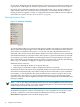
Table Of Contents
- HP Neoview Management Dashboard Client Guide for Database Administrators
- Table of Contents
- About This Document
- 1 Introduction to Dashboard
- 2 Installing the Client
- 3 Starting and Running the Client
- 4 Using the Client Windows
- Browse Window
- Browse Window Toolbar Button Summary
- Browsing and Analyzing Segments, Entities, and Objects
- Other Browse Window Toolbar Functions
- Command Wizard Toolbar Button
- Download Wizard Toolbar Button
- Object State Change Toolbar Button
- OEM Toolbar Button
- OIL Toolbar Button
- Properties Toolbar Button
- Refresh With Latest Data Button
- Rotate Graph Control
- Rotate Graph Toolbar Button
- Sort View Toolbar Button
- Suppress States Toolbar Button
- Thresholds Toolbar Button
- Browse Window Pull-Down Menus
- Browse Window File, Edit, View, and Help Menus
- Browse Window Shortcut Menus
- Object State Changes (OSC) Window
- Graph Window
- Report Window
- Session Window
- 5 Using the Client Property Sheets
- Attribute Property Sheet
- Font Property Sheet
- General Property Sheet
- Annotate Grid With States Check Box
- Clear Registry Button
- Command Wizard Check Box
- Data Query Tool Bar Enable Check Box
- Icons Button
- New Graph on Data Grid Double Click Check Box
- Reports Auto Refresh Check Box
- Set Password Button
- Show Help in Grid Check Box
- Show Splash Screen Check Box
- Show Removed Objects Check Box
- Stretch/Compress Grid Columns to Fit Window Check Box
- Graph Property Sheet
- Icon Server Control Panel
- OEM Property Sheet
- OIL Property Sheet
- OSC Property Sheet
- Monitor Object State Changes Check Box
- Display Log Window Check Box
- State Upgrades Monitored Check Box
- Notify Button
- State Downgrades Monitored Check Box
- Minimum State Change Monitored List
- Maximum Change History Retained in Log List
- Late Data Integrity Check List
- Audible Alert State Threshold List
- Notify Control Panel
- SSG Property Sheet
- Client Server Gateway Check Box
- Retrieval Options
- Sample Delay Options
- Trace Requests Check Box
- Trace Replies Check Box
- Trace Audits Check Box
- Show CSG Until Connected Check Box
- Auto Connect to CSG at Startup Check Box
- Auto Restart Session Check Box
- Max Rows/Object Field
- SSG/CSG Advanced Button
- SSG/CSG Advanced Control Panel
- Exit Shutdown Check Box
- Data Cache Check Box
- SSG Cache Field
- Enable Flow Control Option
- Disable Flow Control Option
- Accept Server Initiated Flow Control Option
- Term Name Check Box
- User Name Field
- Defaults Button
- 6 Using Entity Screen Information
- 7 Using Command and Control to Manage Queries
- 8 Switching Between Neoview Platforms
- Index
Selecting a View
To indicate what kind of data you want to see in the Browse window, you make selections from
lists that appear along the top of the Browse window. For example, you might want to see a
display of data for all disks on a specified segment and to limit the display to disks that have
warnings associated with them. The combination of criteria that you specify is called a “view.”
NOTE: Although this manual refers to the Segment list, the Entity list, the Object list, and the
Samples list, those lists are not labeled in the Browse window. Rather, they occur in order, from
left to right, along the top of the window and are recognizable by the values that they contain:
the Segment list displays an initial value like \HPQ0101, the Entity list a value like Disk, and so
on.
Each time you select a different view, Dashboard retains the segment, entity, object, samples,
and minimum state settings for that view. The Browse window retains the last two dozen view
settings for the window, allowing you to navigate conveniently from one view to another.
To browse backward or forward through the view history, use the Browse window View > Back
and View > Next menu items or toolbar buttons.
To select a different view using the toolbar button, either:
• Click the View > Back/Next button.
— To select the previous view, click the up arrow of the button.
— To select the next view in the history, click the down arrow of the button.
• Select the Browse window View menu.
— To see the previous view, select View > Back.
— To see the next view in the history, select View > Next.
Selecting a Segment
To change the segments displayed in the Browse window, use the Segment list or the toolbar.
The names in the Segment list display the segments that the Dashboard host configuration
monitors. For example, if Dashboard monitor processes are running on the segments \HPQ0101,
\HPQ0102, and \HPQ0103, these segment names appear in the Dashboard Segment list.
To select a segment using the Segment list:
1. Click the arrow in the Segment list.
2. Select the desired segment from the Segment list, or select all items in the list by selecting
the asterisk (*).
To select a segment using the toolbar, click one of these buttons:
Selects all segments in the Browse window
Selects the previous segment in the Segment list
Selects the next segment in the Segment list
Browsing and Analyzing Segments, Entities, and Objects 31