
Neoview Management Dashboard Client Guide for Database Administrators (R2.3)


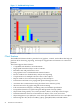
Table Of Contents
- HP Neoview Management Dashboard Client Guide for Database Administrators
- Table of Contents
- About This Document
- 1 Introduction to Dashboard
- 2 Installing the Client
- 3 Starting and Running the Client
- 4 Using the Client Windows
- Browse Window
- Browse Window Toolbar Button Summary
- Browsing and Analyzing Segments, Entities, and Objects
- Other Browse Window Toolbar Functions
- Command Wizard Toolbar Button
- Download Wizard Toolbar Button
- Object State Change Toolbar Button
- OEM Toolbar Button
- OIL Toolbar Button
- Properties Toolbar Button
- Refresh With Latest Data Button
- Rotate Graph Control
- Rotate Graph Toolbar Button
- Sort View Toolbar Button
- Suppress States Toolbar Button
- Thresholds Toolbar Button
- Browse Window Pull-Down Menus
- Browse Window File, Edit, View, and Help Menus
- Browse Window Shortcut Menus
- Object State Changes (OSC) Window
- Graph Window
- Report Window
- Session Window
- 5 Using the Client Property Sheets
- Attribute Property Sheet
- Font Property Sheet
- General Property Sheet
- Annotate Grid With States Check Box
- Clear Registry Button
- Command Wizard Check Box
- Data Query Tool Bar Enable Check Box
- Icons Button
- New Graph on Data Grid Double Click Check Box
- Reports Auto Refresh Check Box
- Set Password Button
- Show Help in Grid Check Box
- Show Splash Screen Check Box
- Show Removed Objects Check Box
- Stretch/Compress Grid Columns to Fit Window Check Box
- Graph Property Sheet
- Icon Server Control Panel
- OEM Property Sheet
- OIL Property Sheet
- OSC Property Sheet
- Monitor Object State Changes Check Box
- Display Log Window Check Box
- State Upgrades Monitored Check Box
- Notify Button
- State Downgrades Monitored Check Box
- Minimum State Change Monitored List
- Maximum Change History Retained in Log List
- Late Data Integrity Check List
- Audible Alert State Threshold List
- Notify Control Panel
- SSG Property Sheet
- Client Server Gateway Check Box
- Retrieval Options
- Sample Delay Options
- Trace Requests Check Box
- Trace Replies Check Box
- Trace Audits Check Box
- Show CSG Until Connected Check Box
- Auto Connect to CSG at Startup Check Box
- Auto Restart Session Check Box
- Max Rows/Object Field
- SSG/CSG Advanced Button
- SSG/CSG Advanced Control Panel
- Exit Shutdown Check Box
- Data Cache Check Box
- SSG Cache Field
- Enable Flow Control Option
- Disable Flow Control Option
- Accept Server Initiated Flow Control Option
- Term Name Check Box
- User Name Field
- Defaults Button
- 6 Using Entity Screen Information
- 7 Using Command and Control to Manage Queries
- 8 Switching Between Neoview Platforms
- Index

1 Introduction to Dashboard
Dashboard Client Overview
The Neoview Management Dashboard provides an infrastructure for monitoring the operational
status and performance of system resources and queries on the Neoview platform.
The Dashboard Client runs on Microsoft Windows XP workstations and provides a graphical
user interface (GUI) to Dashboard statistics and intelligent agent functions. The Client
communicates with Dashboard server components on the Neoview platform through the Client
Server Gateway (CSG).
The Client GUI displays Neoview platform performance and state information and availability
statistics for system and application objects. From the Client, you can view and analyze real-time
or historical views of CPU, Disk, ProcessBusy, Query, QueryRTS, Table, and TMF entities from
all reporting segments.
Informational views can encompass all the segments in a Neoview platform; reflect a selected
set of segments; or focus on a single segment, entity, or object.
The Client provides access to the Command and Control feature, which allows authorized users
to suspend, resume, and kill Neoview SQL queries running on a Neoview platform. You access
Command and Control for a selected query using a shortcut menu from Query entity grid, graph,
and sort views. For information about using Command and Control, see Chapter 7 (page 103).
The Client has built-in agent functions that run on Windows XP. The Client automatically retrieves
and analyzes statistics from the Dashboard on the Neoview platform.
The Client communicates object information to the Open Enterprise Management Gateway
(OEM). State information is also reported, letting enterprise management frameworks supported
by OEM adapters display objects and their operational states. Client services can be configured
to notify you by e-mail, phone, or pager and to forward object statistics and state information to
e-mail servers or to enterprise management frameworks through the OEM.
Figure 1-1 shows one of the Dashboard entity screens displayed from the Client. For more
information about the entity screens, see Chapter 6 (page 83).
Dashboard Client Overview 19