
Neoview Management Dashboard Client Guide for Database Administrators (R2.3)

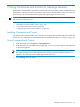
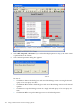
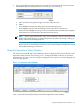
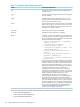


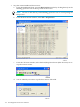
Table Of Contents
- HP Neoview Management Dashboard Client Guide for Database Administrators
- Table of Contents
- About This Document
- 1 Introduction to Dashboard
- 2 Installing the Client
- 3 Starting and Running the Client
- 4 Using the Client Windows
- Browse Window
- Browse Window Toolbar Button Summary
- Browsing and Analyzing Segments, Entities, and Objects
- Other Browse Window Toolbar Functions
- Command Wizard Toolbar Button
- Download Wizard Toolbar Button
- Object State Change Toolbar Button
- OEM Toolbar Button
- OIL Toolbar Button
- Properties Toolbar Button
- Refresh With Latest Data Button
- Rotate Graph Control
- Rotate Graph Toolbar Button
- Sort View Toolbar Button
- Suppress States Toolbar Button
- Thresholds Toolbar Button
- Browse Window Pull-Down Menus
- Browse Window File, Edit, View, and Help Menus
- Browse Window Shortcut Menus
- Object State Changes (OSC) Window
- Graph Window
- Report Window
- Session Window
- 5 Using the Client Property Sheets
- Attribute Property Sheet
- Font Property Sheet
- General Property Sheet
- Annotate Grid With States Check Box
- Clear Registry Button
- Command Wizard Check Box
- Data Query Tool Bar Enable Check Box
- Icons Button
- New Graph on Data Grid Double Click Check Box
- Reports Auto Refresh Check Box
- Set Password Button
- Show Help in Grid Check Box
- Show Splash Screen Check Box
- Show Removed Objects Check Box
- Stretch/Compress Grid Columns to Fit Window Check Box
- Graph Property Sheet
- Icon Server Control Panel
- OEM Property Sheet
- OIL Property Sheet
- OSC Property Sheet
- Monitor Object State Changes Check Box
- Display Log Window Check Box
- State Upgrades Monitored Check Box
- Notify Button
- State Downgrades Monitored Check Box
- Minimum State Change Monitored List
- Maximum Change History Retained in Log List
- Late Data Integrity Check List
- Audible Alert State Threshold List
- Notify Control Panel
- SSG Property Sheet
- Client Server Gateway Check Box
- Retrieval Options
- Sample Delay Options
- Trace Requests Check Box
- Trace Replies Check Box
- Trace Audits Check Box
- Show CSG Until Connected Check Box
- Auto Connect to CSG at Startup Check Box
- Auto Restart Session Check Box
- Max Rows/Object Field
- SSG/CSG Advanced Button
- SSG/CSG Advanced Control Panel
- Exit Shutdown Check Box
- Data Cache Check Box
- SSG Cache Field
- Enable Flow Control Option
- Disable Flow Control Option
- Accept Server Initiated Flow Control Option
- Term Name Check Box
- User Name Field
- Defaults Button
- 6 Using Entity Screen Information
- 7 Using Command and Control to Manage Queries
- 8 Switching Between Neoview Platforms
- Index
7 Using Command and Control to Manage Queries
Dashboard Command and Control allows authorized users to suspend, resume, and kill Neoview
SQL queries running on a Neoview platform. You access Command and Control for a selected
query using a shortcut menu from the Query entity grid, graph, and sort views.
NOTE: The Suspend and Resume commands are disabled in the current release of Dashboard
but are reserved for future use.
This section describes these topics:
• “Installing Command and Control” (page 103)
• “Using Command and Control” (page 103)
• “Using the Operations Status Window” (page 105)
Installing Command and Control
The Client-side Command and Control software is automatically installed when you install the
Client on your workstation. For information about installing the Client, see Chapter 2 (page 23).
Using Command and Control
1. From the Client, open the Query or QueryRTSentity.
2. From the Query or QueryRTS entity graph, grid, or sort view, select a query and right-click
it. The menu appears.
NOTE: You can select multiple queries from the grid view by holding down the SHIFT
key while clicking on each of the queries or by clicking on the first and last queries in a
sequence. You can only select a single query from Sort view.
3. Select Manage from the menu.
Installing Command and Control 103