
Neoview Management Dashboard Client Guide for Database Administrators (R2.2)

Show Utilization in OEM Check Box
To display state icons representing alert levels of segments, entities, and objects in the OEM,
select the Show Utilization in OEM check box.
When this check box is selected, icons are automatically propagated upward through the OEM
hierarchy based on the state determination algorithms you specify. You can specify utilization
thresholds using the Thresholds button on the OEM property sheet. You can also access thresholds
through the Browse window Thresholds toolbar button.
If you clear this option, performance utilization icons do not appear in the OEM, but you can
still get performance information for objects in the OEM by right-clicking the object and then
selected the Performance menu.
OEM Full Context List
The OEM Full Context list controls the amount of object-state information passed to the OEM.
Normal Context is the default that provides limited information. Other options are Full Context
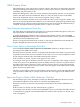
as XML and Full Context as CSV format. The OEM context options are
When this option is selected, the Client context string for
each object contains only the name and value of the
attribute with the highest alert state. This option is the
default context string.
Normal Context
When this option is selected, the Client appends XML
name value pairs for each entity attribute name and
value that has its Show in Graph property enabled. The
XML tag name will be the same as the Attribute heading
property (for example, busy 98 full 66). Prior to
name value pairs, a context sting similar to Normal context
appears. For example:\Neo001\Cpu\01:6:"Busy% 72
Status Up Time 10:01 Busy% 72 Queue 4 Disk
28 Chit 85 Swap
4",\Neo001\Disk\$Asap:2:"Status UpStatusUp
Time17:17Full% 36Busy%17.5Write% 8.4 Read%
9
Fragment23241.2",\Neo001\File\Home\Sales\Pricing.db:2:"Status
Up Status Up Time 09:10 Full% 0 Owner 255
Rwep nnnn Files 1"
Full Context as XML
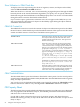
When this setting is selected, the Client appends comma
separated values (CSV) for each entity attribute name and
value that has its Show in Graph property enabled. The
name is the same as the attribute heading property.
Full Context as CSV
OEM Thresholds Button
The Thresholds button opens the Utilization Thresholds control panel. Use this control panel to
set performance utilization thresholds used by Dashboard to alert the OEM framework of segment,
entity, and object performance.
You can also access the Utilization Thresholds control panel by clicking the Thresholds toolbar
button in the Browse window or by selecting View > Thresholds in the Browse window.
OIL Property Sheet
The OIL property sheet controls whether the Object Integration Layer (OIL) tree view is displayed,
how it is populated with Dashboard objects, and whether performance utilization thresholds
and alert icons are shown in the OIL.
Use the OIL to obtain a hierarchical tree view of segments, entities, and objects known to
Dashboard. Selecting an entity or object in the OIL causes the Browse window to report on that
entity or object.
70 Using the Client Property Sheets