
Neoview Management Dashboard Client Guide for Database Administrators (R2.2)

State Determination ALL Button
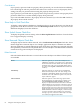
The State Determination ALL button is an advanced feature that selects a range of attributes
from the first attribute that has a state attribute associated with it through the last attribute for
the current entity.
This button lets you quickly select a range of attributes starting with the first attribute that has
a state associated with it, also known as a value,state StatePair. Once you select these attributes
using the ALL button, you can set the State Determination rule for all StatePair attributes all at
once rather than individually.
For example, to set the State Determination rule for all StatePairs to UseStateGraphState, click
the ALL button and then select the State Determination Rule labelled Use State > Graph State.
Conversely, to set the State Determination rule for all StatePairs to UseThresholds, click the ALL
button and then select the State Determination Rule labelled Use Thresholds. The Status attribute
for the entity is not set to UseThresholds. By definition, its state determination rule is
UseStateGraphState.
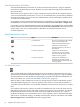
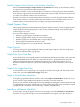
State Determination Options
DescriptionOptionIcon
The state of an attribute is determined
by the values specified in the
Utilization Thresholds dialog box.
Use Thresholds
Attribute state information is
determined directly by the value of
that attribute.
Use Value Graph Value
Attribute state information is
determined by the state variable
associated with that attribute. The
attribute value is graphed.
Use State Graph Value
Attribute state information is
determined by the state variable
associated with that attribute. The state
value is graphed.
Use State Graph State
Use Thresholds Option
The Use Thresholds option indicates that the state of an attribute is determined by the values
specified in the Utilization Thresholds dialog box. When you set this property for a given attribute,
state determination for the attribute is based entirely on Dashboard utilization thresholds. For
more information, see “Utilization Thresholds Control Panel” (page 72).
When an object's Time attribute has its Show in Graph check box and Use Thresholds options
selected, Dashboard performs a series of automatic time checks to ensure that the time has a
reasonable value. If the time is not reasonable, Dashboard raises the state of the time to an alert
level.
For example, if the time for statistics received from Dashboard is not recent, the Time state for
that object is reported as down, and a Red or Yellow Icon appears next to the time. You should
enable Dashboard time checks because this mechanism helps in the analysis of a variety of
problems, including: server and database errors, down segments, down communication paths,
and incorrect system time settings. To disable Late Data time checks for all entities, select Late
Data Integrity Check > No Check on the OSC Property Sheet.
62 Using the Client Property Sheets