
Neoview Management Dashboard Client Guide for Database Administrators (R2.2)
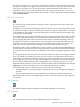

Use this dialog to:
• Control which attributes are displayed in the data grid of Browse windows
• Control which attributes are displayed in the graphs of Browse and Graph windows
• Set the normalization value for attributes
• Set the state determination algorithm for attributes
• Find the exact meaning of a specific entity attribute
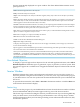
For example, to see the description of an attribute for an entity:
1. Specify the entity, to display its attributes in the Attribute property sheet:
a. Click the Entity down arrow.
b. Select the entity you want.
The attributes of the selected entity appear in the list box below the entity name.
2. Select an attribute from the Attributes list.
A technical description of the selected performance attribute appears in the Selected Attribute
text area to the right of the Attributes list.
Getting Help for an Entity Attribute
To find information about a specific performance attribute:
1. Scroll through the Attributes list.
2. Select the name of the attribute.
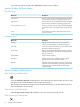
Show Attribute in Grid Check Box
To display or suppress an attribute in the data grid of the Browse window:
1. Select the attribute from the Attribute property sheet.
2. Select the Show Attribute in Grid check box, or double-click the first column of the selected
attribute.
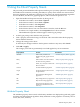
Show in Graph Check Box
To display or suppress an attribute in the graph portion of Graph and Browse windows:
1. Select the attribute from the Attribute property sheet.
2. Select the Show in Graph check box, or double-click the second column of the selected
attribute.
When an object's data attribute has its Show in Graph check box selected, Dashboard analyzes
the attribute and assigns a state to the attribute.
When the Show in Graph property of an attribute is selected, the attribute state appears in the
form of color-coded graph elements and in annotated-state icons in the OIL, OEM, and data
grids.
The rule used to determine the state of a data attribute is based on the State Determination setting
for the attribute. For more information, see “State Determination” (page 61).
When an object’s time attribute has its Show in Graph check box and Use Thresholds options
selected, Dashboard performs a series of automatic timestamp checks to ensure that the time has
a reasonable value. If the time is not reasonable, Dashboard raises the state of the time to an alert
level.
To disable Late Data time checks for all entities, select the No Check option of Late Data Integrity
Check in the OSC Property Sheet. For example, to disable Late Time time checking for a specific
entity, clear Show in Graph for its Time property from the Attribute property sheet. To disable
Late Data time checks for all entities, select No Check from the OSC Property Sheet.
60 Using the Client Property Sheets