
HP Virtualization Manager 6.0 Software with Logical Server Management User Guide
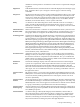
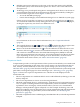
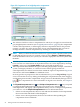
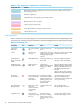
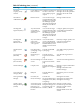
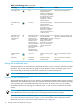
Table Of Contents
- HP Insight Virtualization Manager 6.0 Software with Logical Server Management: User Guide
- Table of Contents
- 1 Introduction
- 2 Getting started with Virtualization Manager
- 3 Working with logical servers
- Using logical servers in Virtualization Manager
- New features in logical servers
- Understanding logical servers as they appear in visualization perspectives
- Logical server operations
- Authorizations, requirements, and configuration
- Logical server requirements
- Configuring and registering VMware vCenter
- Configuring VMware vSphere client settings for browsing datastore
- Configuring HP SIM with Onboard Administrator credentials
- Configuring HP SIM for SAN storage validation
- Configuring Extensible Server & Storage Adapter (ESA)
- Configuring Storage Provisioning Manager (SPM)
- LSMUTIL database utility
- 4 Defining storage for logical servers
- 5 Troubleshooting
- Navigation tips
- User preferences tips
- Performance tips
- Problems with meters collecting data
- Search button displays error page
- Displaying empty, hidden resource pools
- Errors accessing single sign-on iLO or Onboard Administrator
- Recovery after logical server operation failures
- Troubleshooting an inoperable logical server
- Correcting problems powering on a logical server
- Logical server operations cannot be cancelled
- Logical Server Automation service fails to start if TCP layer ports are in use
- Use portable WWNs and MAC addresses for Virtual Connect domain groups
- Do not use valid host name as logical server name
- Oversubscribing the number of networks
- Insufficient NICs error when activating or moving logical servers (Virtual Connect Flex-10 support)
- Use caution when renaming or moving a Virtual Connect domain group
- Deactivate or move logical servers before replacing blade
- Unmanaging a logical server using a storage pool entry may result in an inconsistent state
- Synchronize clocks on the CMS, managed systems, and VMware vCenter
- Ensure VM Hosts use fully qualified host names
- VM Hosts must be in same vCenter for ESX virtual machine logical server moves
- VM displayed without association in Virtualization Manager perspectives after deactivation
- Moving logical servers when the CMS and vCenter are in different network domains
- Changing the IP address of a VM Host after logical server discovery prevents the VM Host from appearing as an activation and move target
- Creating and managing logical servers on Microsoft Windows Hyper-V Server 2008
- 6 Advanced features
- 7 Support and other resources
- Index
In Figure 2-2, information for the standalone server citrine is expanded, so the Collapse
Compartment button appears, whereas the standalone server azul is collapsed, so the
Expand Compartment button appears.
NOTE: When you collapse a selected subcompartment's parent in the compartment
hierarchy and then expand it, it deselects that subcompartment. To perform actions on that
subcompartment, you must again select the subcompartment check box.
5
At any level of the compartment hierarchy, click the Focus icon to focus the view on only
one compartment. This removes all other compartments outside the node hierarchy from
the display.
6
Hover over the information callout icon to view expanded information about systems
and workloads, depending on which aspect you are viewing. (To display workloads, check
the box next to Show Workloads on the Virtualization Manager toolbar.) The information
callout also defines the icons that appear under the compartment name with links to those
technologies. For information on these icons, see “Technology icons” (page 28).
The meter callout icon shows expanded information about the utilization meters that
appear to the left of the icon. The utilization meters display the recent utilization metrics for
CPU, memory, disk, and LAN. These metrics are obtained from the Utilization Provider,
Virtual Machine Management, or other sources depending on the physical or virtual system
you are viewing. Power meters are provided for any physical server, including standalone
servers, nPartitions, or server blades. Clicking the meters takes you to the appropriate
Capacity Advisor historical data page. In addition, meter callouts can contain links to gWLM
realtime or historical data as applicable. For more information on utilization metrics, see
“Reviewing real-time utilization data” (page 91).
7
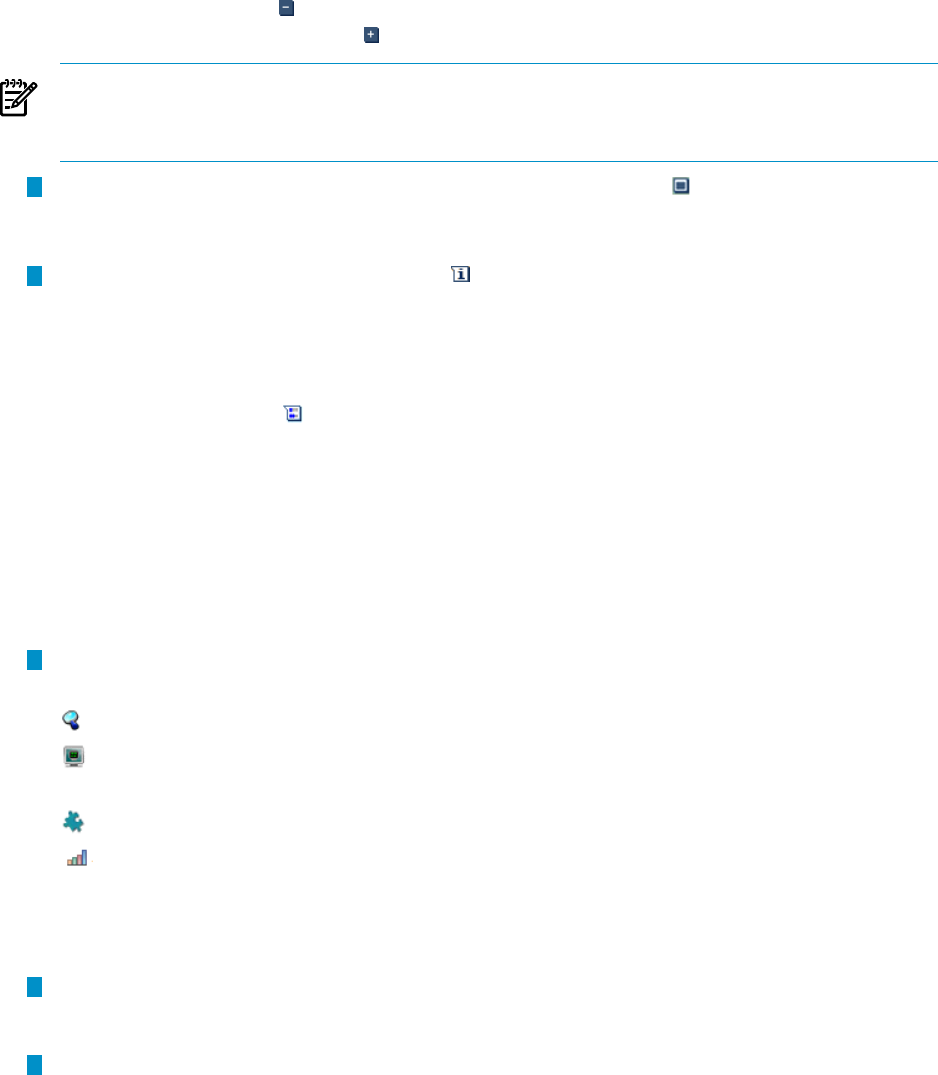
This technology icons allow you to quickly launch management applications, go to
configuration pages, or view profile information. In Figure 2-2, the following icons appear:
Launches the HP SIM system page.
Launches HP Integrity Virtual Machines Manager host or VMM host system page,
depending on whether system is an Integrity Virtual Machine Host or a VMware Host.
Launches the Partition Manager for a complex or nPartition.
Launches the HP Instant Capacity (iCAP) host page for an nPartition and virtual partition,
or the iCAP complex page for a complex.
Click on any technology icon to go to the applicable page. See “Technology icons” (page 28)
for information about all available technology icons.
8
This subcompartment shows an nPartition with six virtual machines in collapsed
subcompartments. Subcompartments are expanded by default; you can change this default
by modifying the user preferences (see “Modifying user preferences” (page 89)).
9
Meters depict utilization metrics for CPU, memory, disk, and LAN obtained from the Virual
Machine Management (VMM) for ESX and Microsoft virtual machines hosts and guests, or
from the Utilization Provider for all other types, depending on what you are viewing. Power
meters are provided for any physical server, including standalone servers, nPartitions, or
server blades. Click on a meter to go to the Capacity Advisor Profile Viewer to see a graphical
display and a tabular summary of resource utilization.
Compartment color definitions
Each compartment has a color bar along the top and left side that identifies the type of system
such as nPartition, virtual partition, VM Host, and so on. Table 2-1 shows the colors displayed
in the Visualization View.
Using the visualization view 27