
HP Matrix Operating Environment Chargeback


Technical white paper | HP Matrix Operating Environment Chargeback
2
Introduction
HP CloudSystem Matrix infrastructure orchestration added chargeback support in version 7.1. Chargeback is a metering
system capable of collecting and exposing allocation usage data for provisioned infrastructure. For more information about
chargeback, see the HP Matrix Operating Environment Infrastructure Orchestration User Guide at
www.hp.com/go/matrixoe/docs.
This white paper update provides additional information about the use of chargeback with cloud hosted resources and
addition of the isInCloud attribute to IP addresses in the 7.3 chargeback API.
The chargeback component collects, stores, and exposes allocation data and cost metrics for services and individual
resources in these services. Collected metrics are accessible through the chargeback web services API and via the command
line interface (CLI), which are available as part of HP Matrix infrastructure orchestration.
The CLI accesses the chargeback web service and retrieves allocation data according to the filters specified in the request.
The retrieved metrics are saved in the filesystem under the name specified in the parameters.
Chargeback data is structured using XML. It contains all of the allocation data and cost metrics required to build a
customized report. Several different tools are able to process XML files and build complex reports; however, there are cases
in which only a simple report is required. This paper describes how to create customized, simple, cleanly formatted and easy
to read reports based on the raw data in the XML files generated by the chargeback CLI.
Chargeback usage report
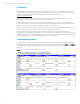
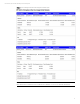
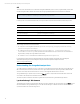
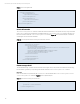
This paper demonstrates how to format chargeback CLI XML output for a better presentation in applications that are able to
open XML files and process XSL transformations such as Microsoft Excel, Word, and Internet Explorer. Figure 1 and Figure 2
show formatted XML output containing detailed service usage information opened as a report in Excel and Internet Explorer,
respectively.
Figure 1. Report containing all allocation metrics displayed in Excel