
HP Integrity Virtual Server Manager 6.0 User Guide
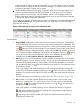

• VSP CPU Utilization: An aggregate showing how busy the VSP is with respect to the processes
and virtual partitions that are executing on it.
• Physical Memory currently in use: A started virtual partition requires the total amount of memory
defined for that virtual partition.
• Physical Network I/O An aggregate of all network I/O that is occurring on the host as a result
of both host and guest access to network devices. Because this is an aggregate, one or more
network devices might be very busy, while others might be idle. For information about specific
devices, see the VSP Network tab.
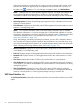
Physical Disk I/O An aggregate of the storage I/O that is occurring on the host as a result of
both host and guest access to storage devices. Because this is an aggregate, one or more
storage devices might be very busy, while others might be idle. For more information about
each device, see the VSP Storage tab.
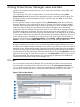
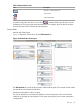
VSP Virtual Servers tab
The VSP Virtual Servers tab displays information about the state of virtual machines and virtual
partitions in the VSP system.
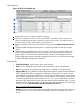
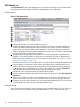
Quick reference
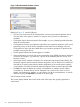
Figure 8 VSP Virtual Servers tab
1
Displays this window in a format suitable for printing.
2
Allows you to perform an action on the virtual machine and virtual partition. Select the box
for a specific virtual machine or virtual partition, then select an action from one of the menus
available on the Virtual Server Manager menu bar. To perform an action on all the virtual
machines or virtual partitions, select the box in the header row.
3
Displays information about the virtual machine and virtual partition by taking you to the vPar
Properties General or VM Properties General tab.
4
Indicates the hardware status of the virtual machine and virtual partition.
5
Indicates whether the OS is running.
6
Utilization meters (bar graphs) display utilization data. Other meters display data about virtual
partition CPU utilization, disk I/O, network I/O, and CPU utilization. (In Figure 8, the virtual
partition information table is only partially visible; some utilization meters are not visible. To
see all the utilization meters in the full-width view, see Figure 9.)
If the data cannot be displayed, the meter is dimmed and a label indicates the probable cause.
For a description of meter labels, see “Utilization meter status/error information” (page 127)
24 Using Virtual Server Manager views and tabs